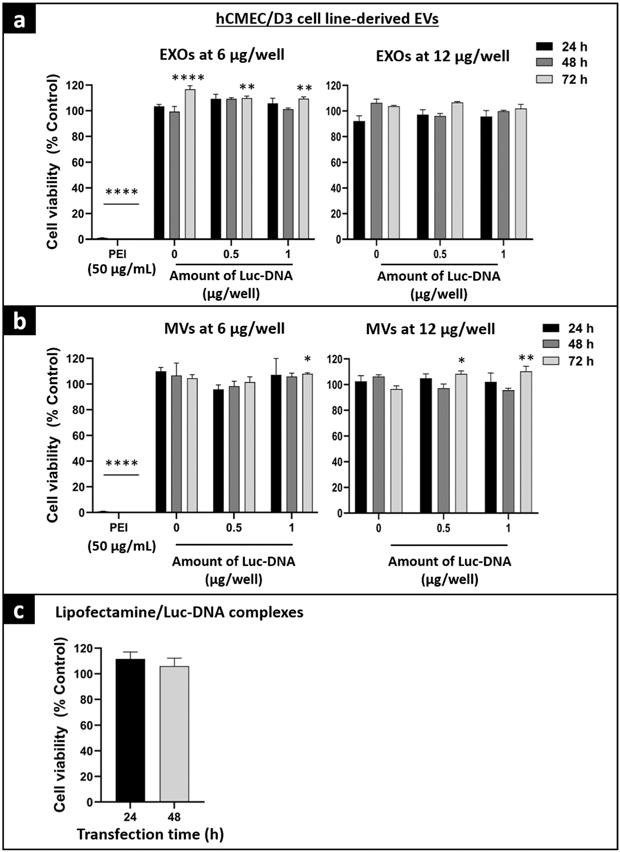
Fig. 6.

Cytocompatibility of hCMEC/D3 cell line–derived Luc-EVs with hCMEC/D3 cells using ATP assay. hCMEC/D3 cells were seeded in collagen-coated 96-well plates at 16,500 cells/well. At about 80% confluency, hCMEC/D3 cells were incubated with 6 or 12 μg of total EXO protein per well isolated from cells pre-transfected with 0, 0.5, and 1 μg Luc-DNA/well (a), 6 or 12 μg of total MV protein per well isolated from 0, 0.5, and 1 μg Luc-DNA/well plates (b), and lipofectamine/Luc-DNA complexes at 10 ng Luc-DNA per well (c). Cells were incubated with EVs for 24, 48, or 72 h, and with Lipofectamine/DNA complexes for the 24- or 48-h exposure time. PEI at 50 μg/mL was used as a positive control and untreated cells were also used as a control. Post-incubation, the CellTiter-Glo 2.0 reagent was added to an equal volume of cell culture media. The plate was measured for luminescence at 1 s integration time using a GloMAX luminometer. The % cell viability of the treated cells was calculated by the (relative luminescence unit (RLU) of treated cells/RLU of untreated cells) × 100. The significance of treated groups was compared against control using Student’s unpaired t test compared with control or one-way ANOVA and the significance levels are indicated as *p < 0.05, **p < 0.01 and ****p < 0.0001
