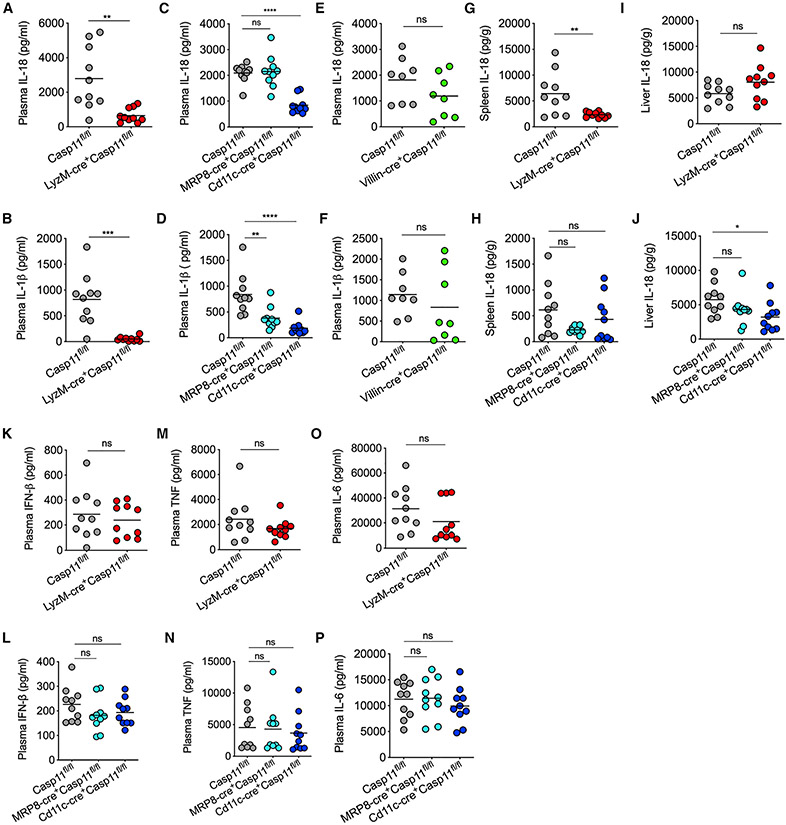
Figure 3. Cell type-specific role of caspase-11 in IL-18 and IL-1β activation during endotoxemia.
(A–F) IL-18 and IL-1β amounts in the plasma of indicated mice 8 h post-LPS injection (20 mg/kg).
(G–J) IL-18 amounts in the spleen and liver of indicated mice 8 h post-LPS injection (20 mg/kg).
(K–P) IFN-β, TNF, and IL-6 amounts in the plasma of indicated mice 8 h post-LPS injection (20 mg/kg).
Combined data from two independent experiments are shown. Each circle represents a mouse, and the horizontal lines represent the mean. *p < 0.05; **p < 0.01; ***p < 0.001; ****p < 0.0001; unpaired two-tailed t test (A, B, E–G, I, K, M, and O) and one-way ANOVA followed by Sidak’s post-test (C, D, H, J, L, N, and P). See also Figures S2 and S3.

