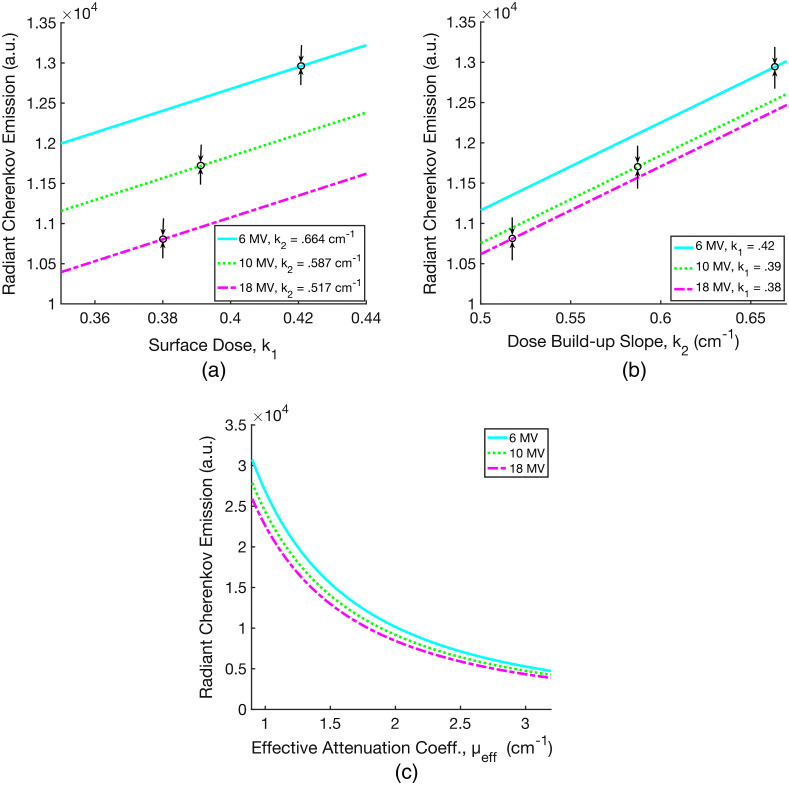
Fig. 5.
The calculated radiant Cherenkov emission from Eqs. (2) and (9) is plotted as a function of surface dose (a), dose build-up slope (b), and the effective attenuation coefficient in tissue (c). In (a), is varied with constant values for 6, 10, and 18 MV x-ray beams as indicated. The black arrows denote the specific and values for the corresponding energies. Figure (b) is analogous to (a), with varied over three constant values for 6, 10, and 18 MV.

