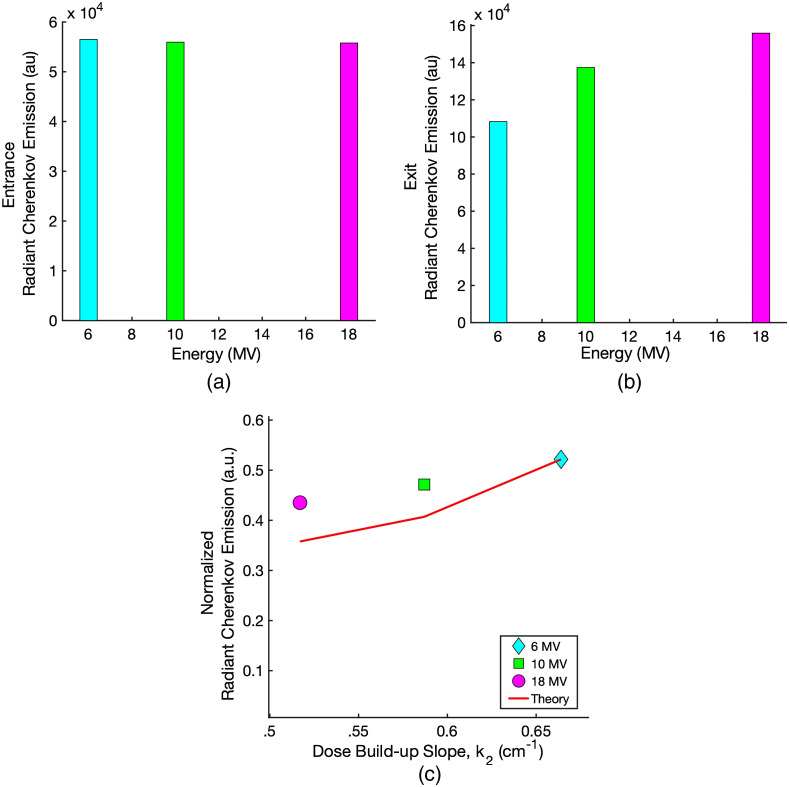
Fig. 8.
The Cherenkov emission from the entrance surface (a) and the exit surface (b) of the 1% blood/1% Intralipid® diffuse liquid tissue phantom as a function of x-ray energy. The measurements were taken over the full range of energies on the Varian TrueBeam linear accelerator. Figure (c) shows the entrance Cherenkov emission normalized by the relative exit Cherenkov emission plotted as a function of the slopes of the Varian Eclipse TPS PDD data. Figure (c) also shows the calculated values of R from Sec. 2.3, which predicts the normalized Cherenkov light emission from the entrance surface.

