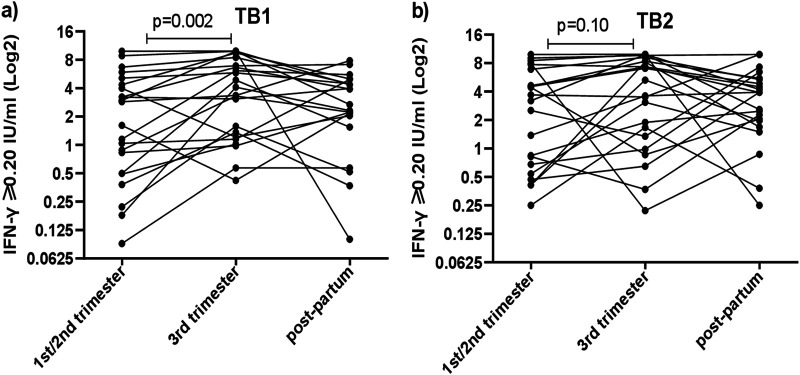
FIG 3.
The line plots represent changes in IFN-γ concentrations triggered by TB1 (a) and TB2 (b) in whole blood of 22 longitudinally tested women (all with QFT of ≥0.20 IU/ml), followed during pregnancy and postpartum. The Friedman test was used to analyze the median difference in the three-time point longitudinal series.

