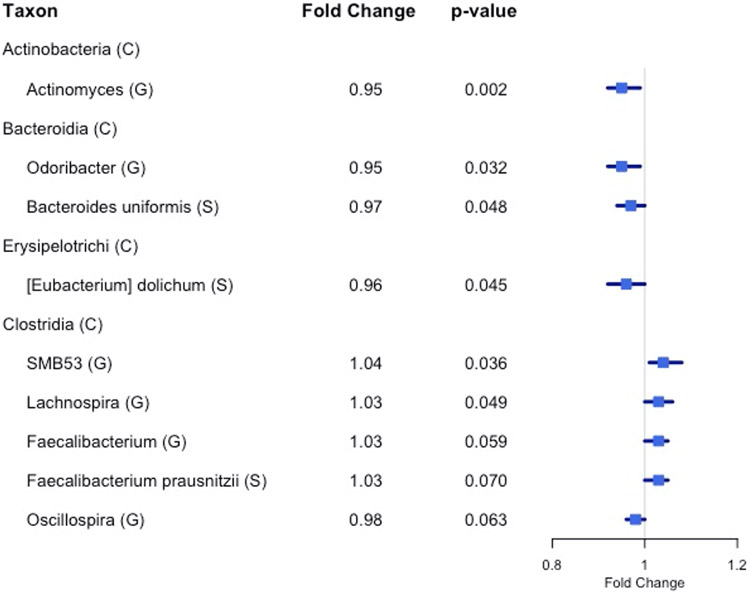
Figure 2. Forest plot of fold change of select genera (G) and species (S) in both NYU and NCI with significant or marginally significant association with higher fiber intake, based on meta-anlysis of the two study populations.
Nominal meta-analysis p-values were calculated based on Z-score methods. (C) denotes class.

