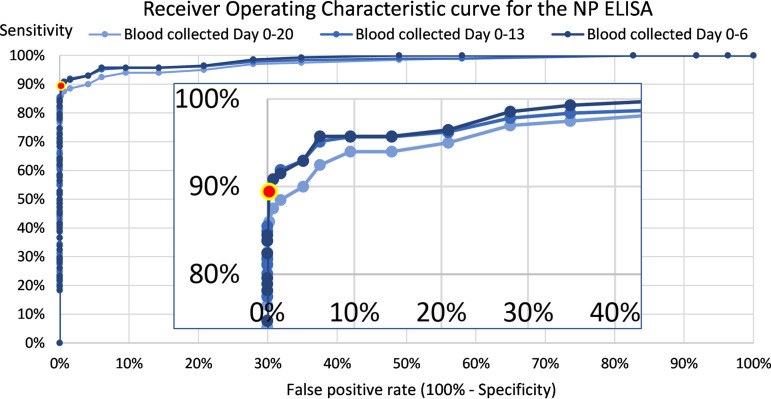
FIG 1.
ROC curves for the SARS-CoV-2 NP ELISA according to the time gap from the first PCR-positive URT swab to first blood sampling. A zoom of the upper left corner of the curves was inserted. The area under the curve was 0.986 for the 604 blood samples collected within a time gap of 1 week (day 0 to 6), 0.982 within 2 weeks (648 blood samples collected day 0 to 13), and 0.975 within 3 weeks (662 blood samples collected day 0 to 20). In compliance with the recommendations by the manufacturer, a diagnostic cutoff at 10 pg/ml secured a combination of very low false-positive rate and high sensitivity (red point with yellow halo).

