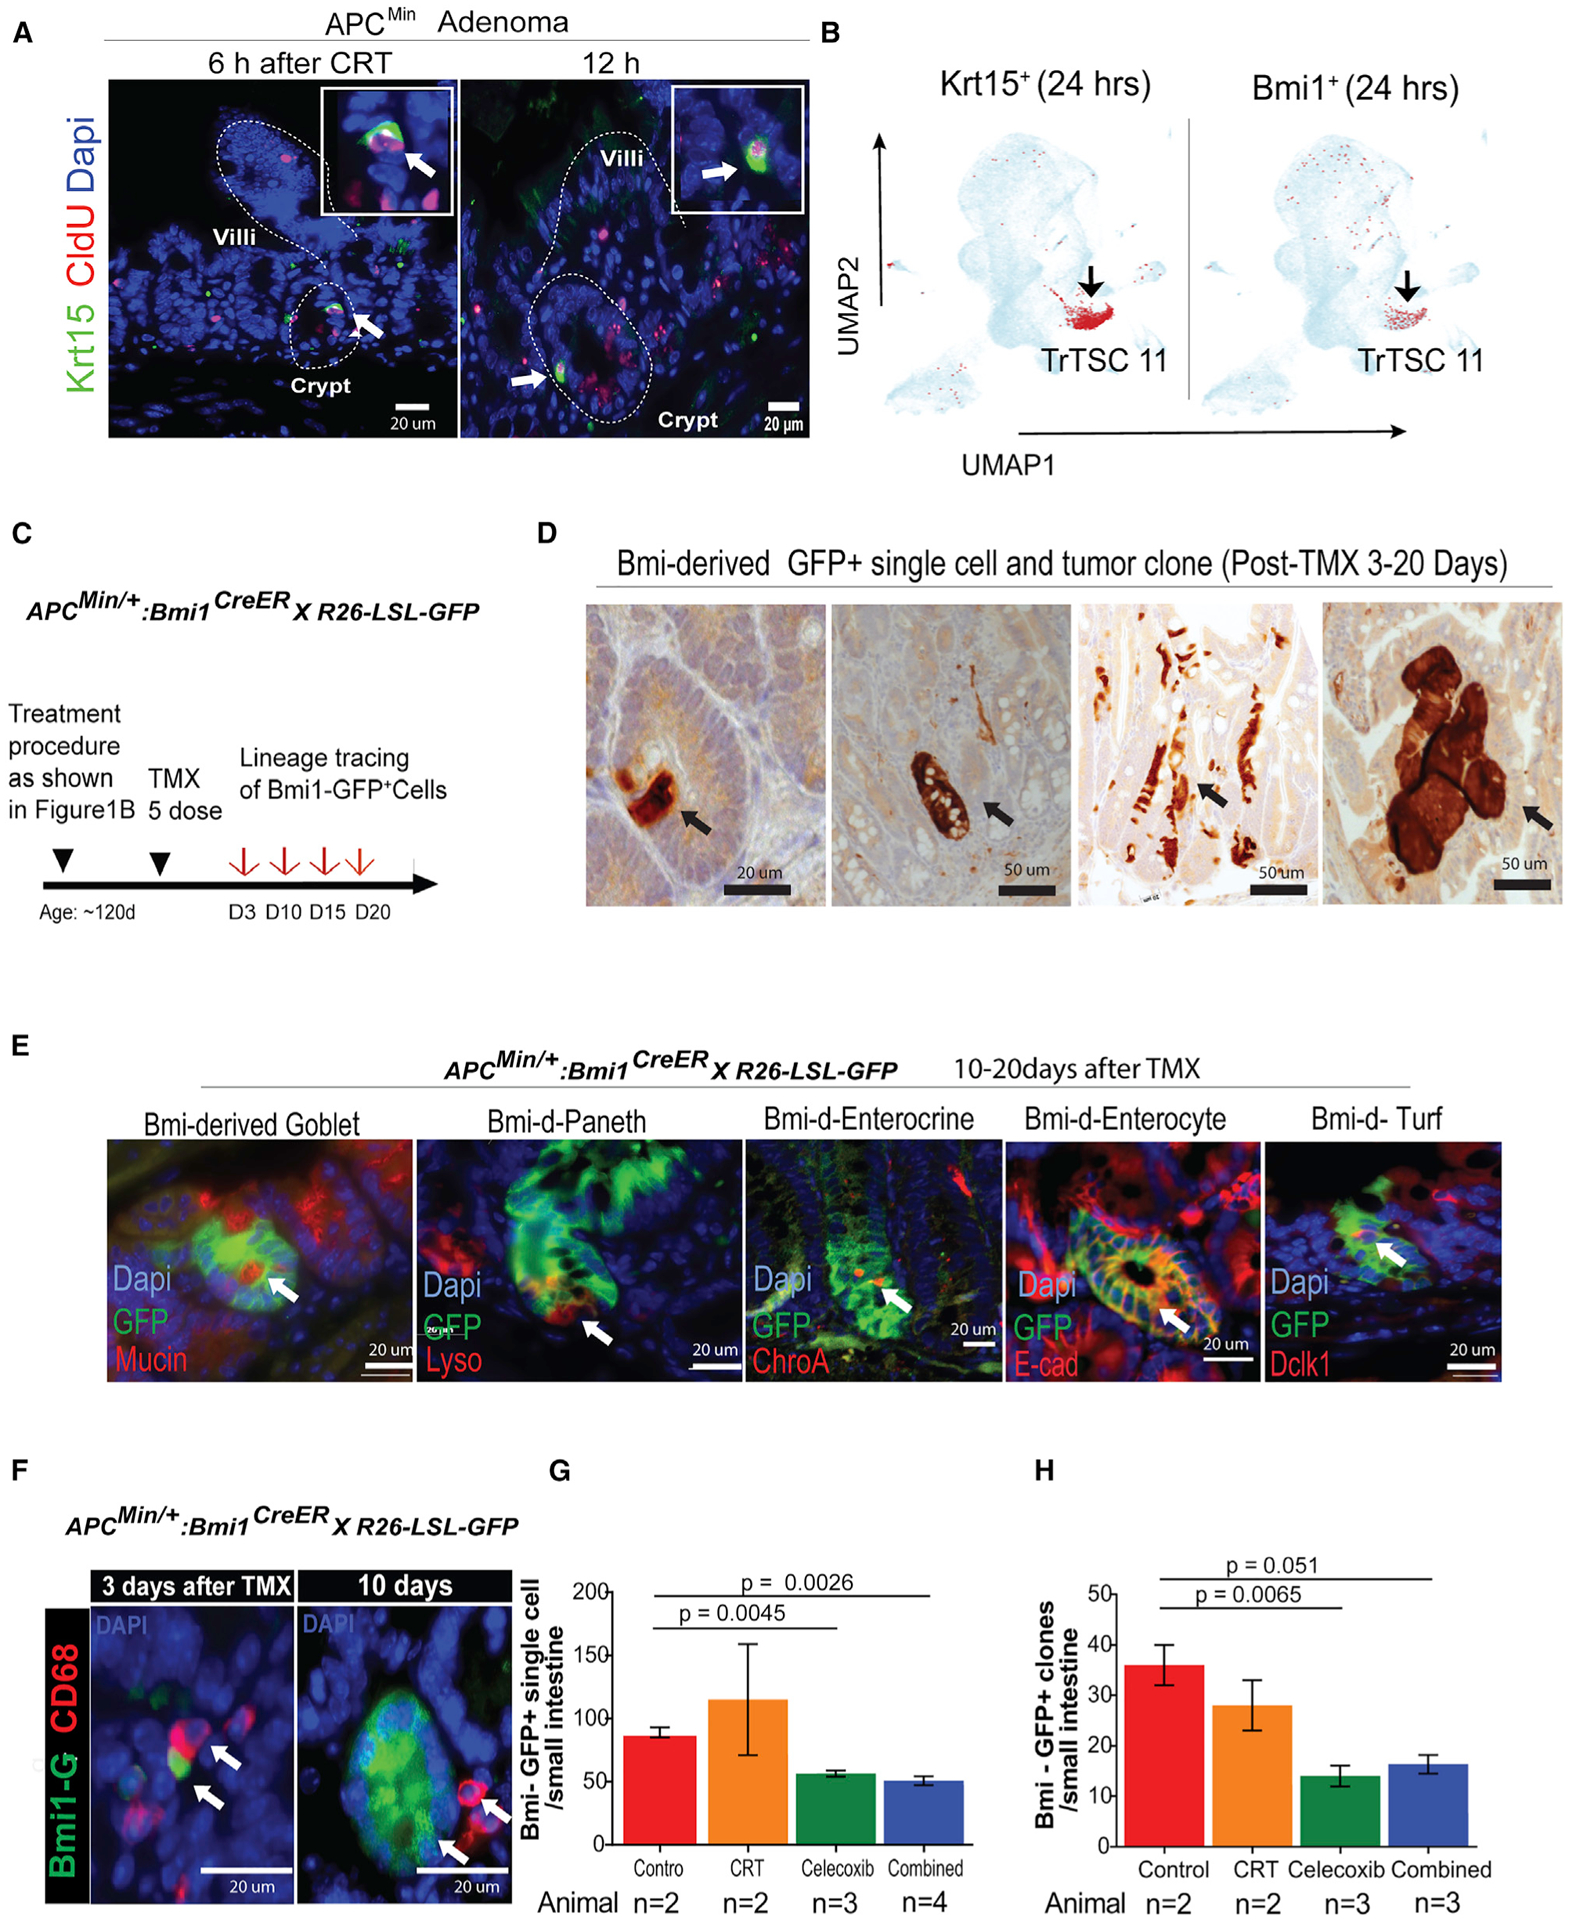
Figure 6. Testing a role of PGE2 signaling in promoting TSCs propagation and tumorigenesis using lineage tracing assay.

(A) IF co-staining of TrCSC markers Krt15 (green) with CldU+ (red) slow-cycling cells.
(B) Predominant expression of Krt15 or Bmi1 in TSC C11 at 24 h after CRT.
(C) The procedure for marking Bmi1-Cre-derived single TSCs.
(D) IH tracing Bmi1-derived tumor clones (brown).
(E) Lineage tracing showing that Bmi1-CreER-derived clones include all four epithelial lineages in intestine.
(F) After TMX induction, association of CD68+ with Bmi1+ (green) single cells and Bmi1-derived tumor clones.
(G) Percentage of Bmi1+ single cells per small intestine with different therapies (*n = 2–4 mice).
(H) Quantification of Bmi1-Cre-derived tumor clones per small intestine with different therapies (*n = 2–3 mice).
*Because of the COVID-19 pandemic, the mouse experiment to increase the control group of animal number in the Bmi1-CreER:R26LSL-GFP:ApcMin/+-induced lineage assay was affected. T-tests, Means+/−SD.
