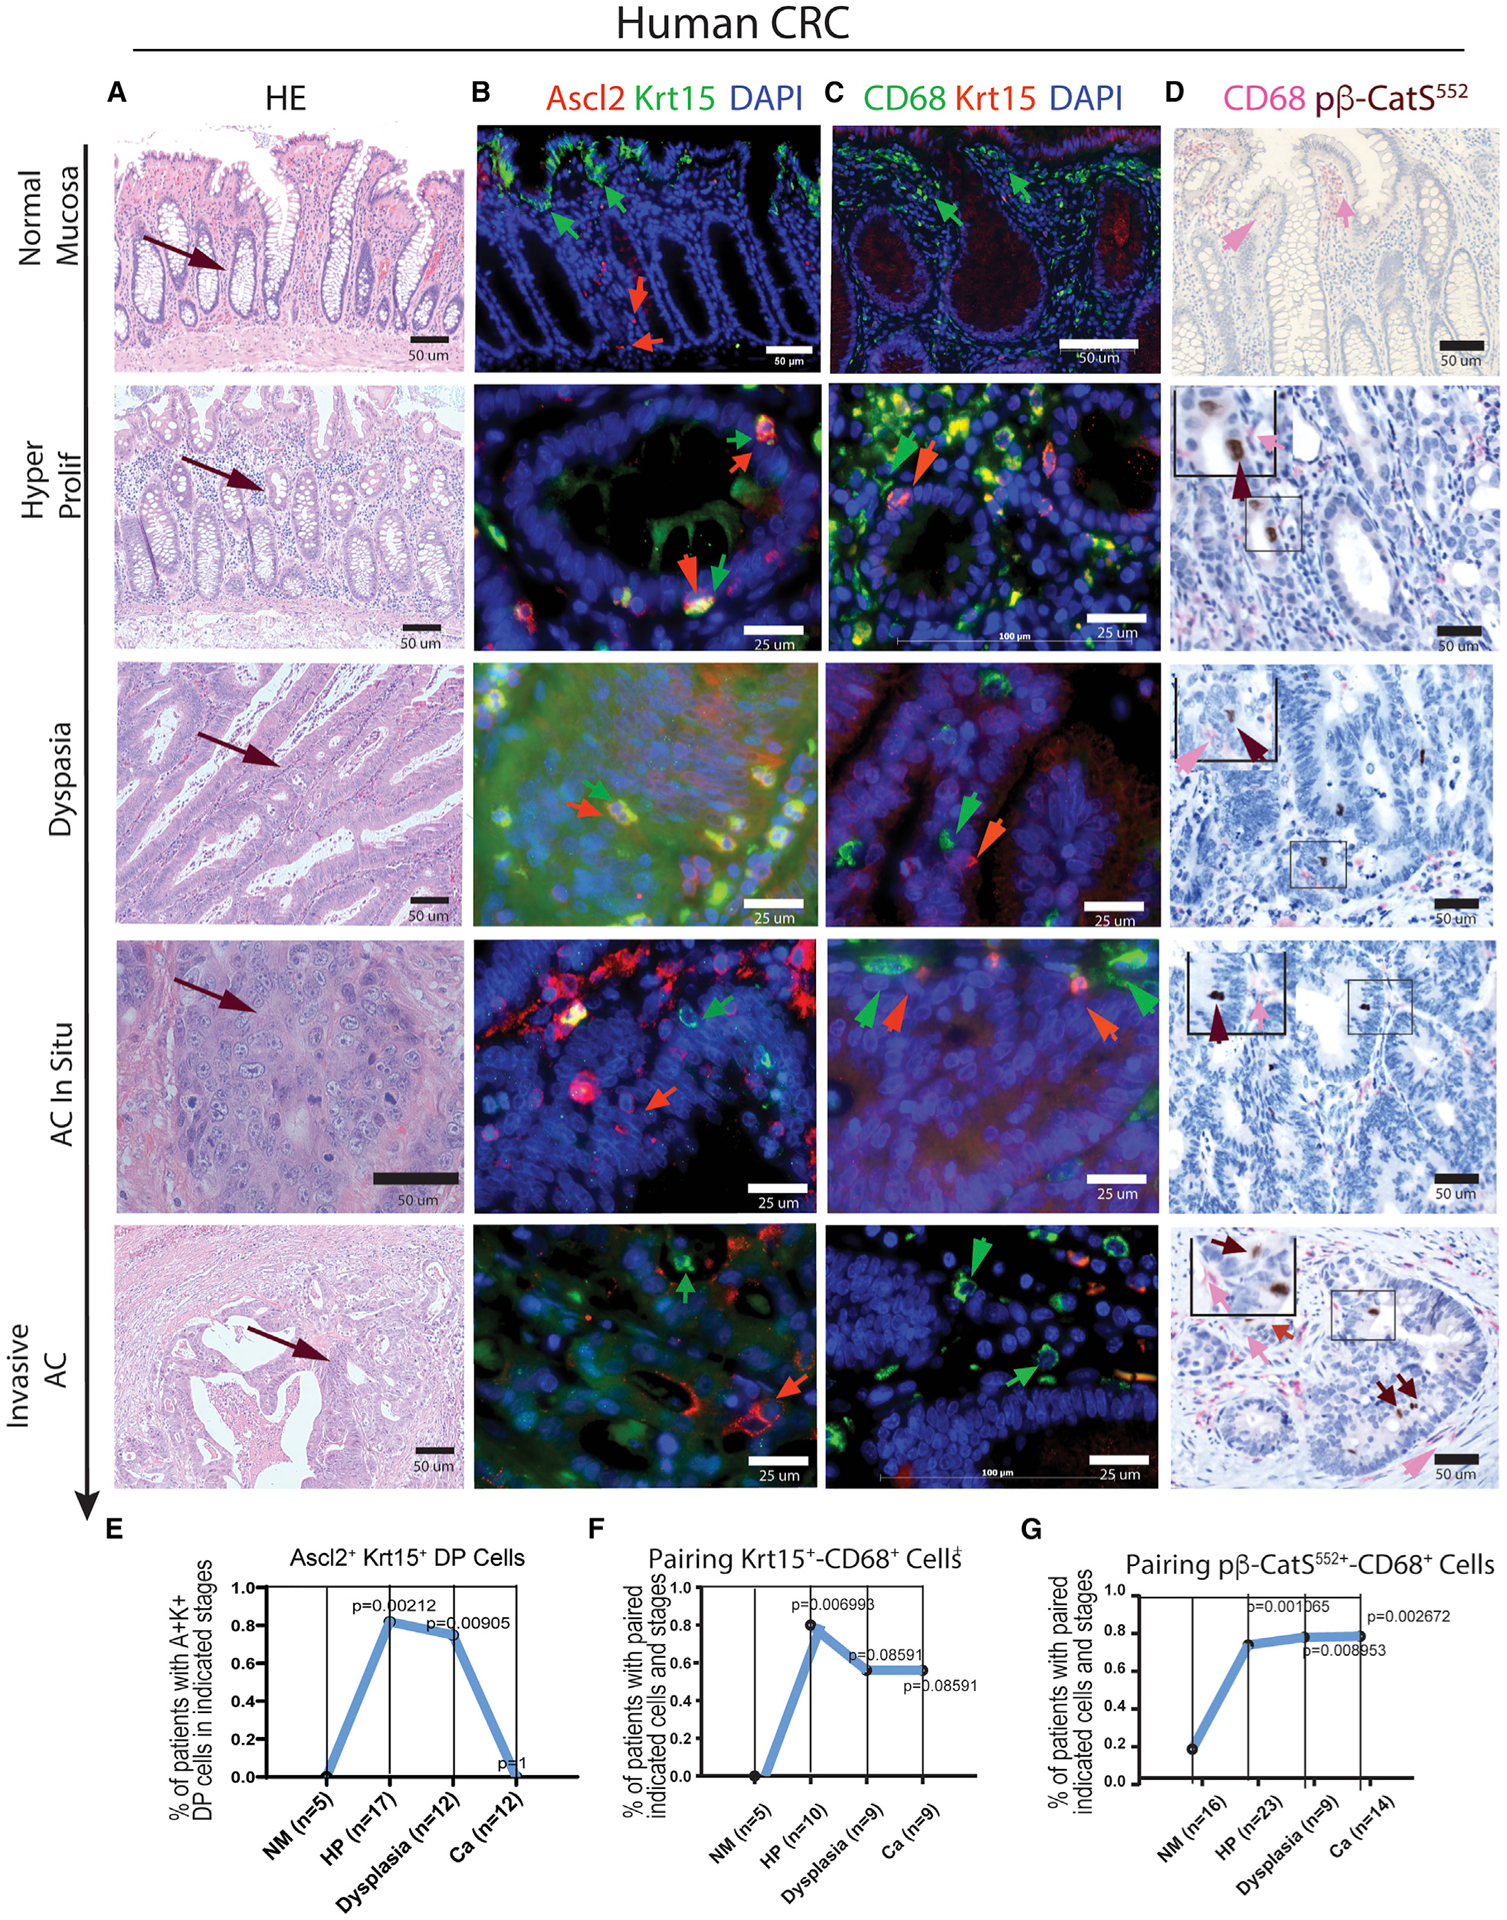
Figure 7. Examination of TrTSC/CSC markers and the association of MDCs with TSC/CSC at different adenoma progression and cancer stages in sections from human CRC patients using IH/IF assay.

(A–D) H&E staining shows the pathological feature of adenoma progression and cancer stages in sections of human CRC (A). With the corresponding sections, the following panels show (B) IF co-staining of markers Krt15 and Ascl2, (C) IF co-staining of CD68 and Krt15, and (D) IHC co-staining of p-β-catS552 and CD68.
(E–G) Statistical analysis of the significance of correlation for detection of Krt15+Ascl2+ TrTSCs (E), association of CD68+ MDCs with Krt15+ TSCs (F), or association of CD68+ MDCs with p-β-catS552 TSCs/CSCs in the corresponding stages in human CRCs (G). Fisher’s exact test was used to test whether the percentage of double-positive samples in HM differed from the ones on the other stages.
