
Figure 4.
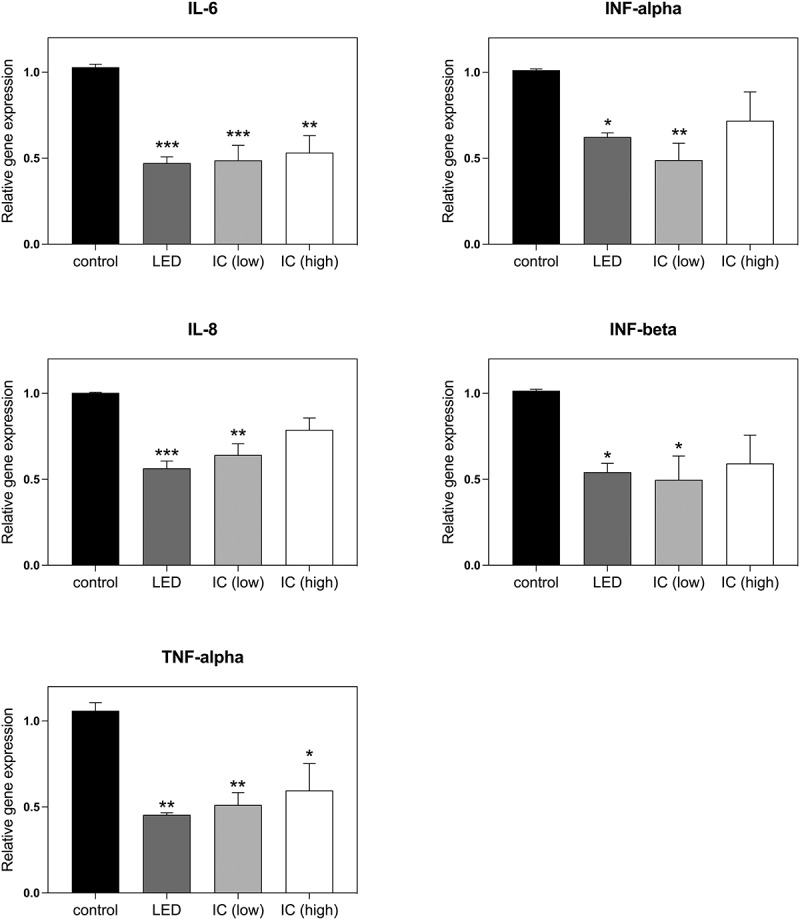
Gene expression analysis of Effect of Infrared Light on Inflammatory markers. Genes induced during the inflammatory response in HEK-TLR4 cell cultures including inflammatory cytokines (IL-6, IL-8) and transcription factors (TNF-α, INF-α, INF-β) were monitored by qPCR analysis subsequent to induction of the inflammatory response by LPS. The control condition represents the expression levels of cell cultures that had not been exposed to infrared light. In the other conditions, cultures were exposed to infrared light for 10 m every 12 h for 48 h as follows: LED: exposure to 6 W/m2 infrared 720 nm LED lights, IC (low): exposure to 6 W/m2 incandescent infrared light bulb (methods); IC (high): exposure to 46 W/m2 incandescent infrared light bulb (methods). Data are shown as mean ± SE of four independent experiments (N = 4). The asterisks indicate significance level of the differences: *p-value < 0.1; ** p-value < 0.01; *** p-value < 0.001