
Figure 3.
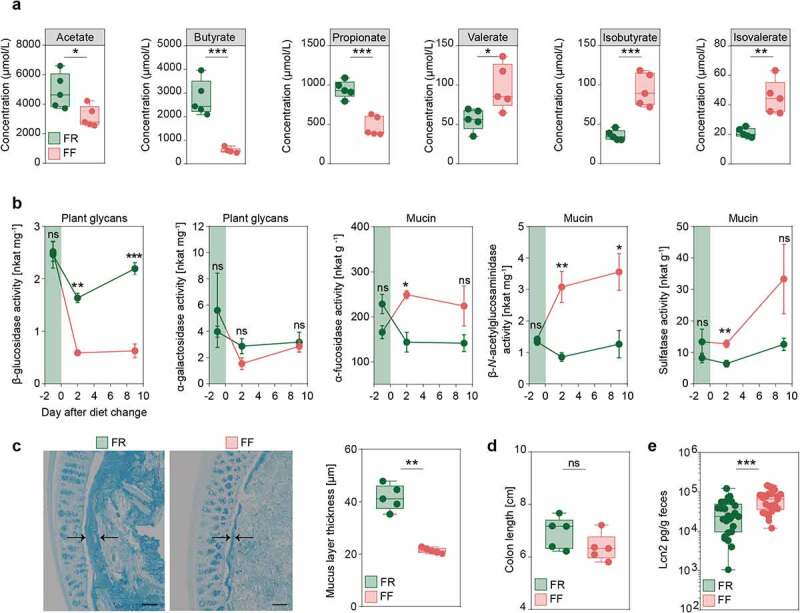
Fiber deprivation in mice harboring a complex microbiome results in changes in bacterial enzyme activity and levels of mucosal barrier integrity markers
Green: FR-fed mice; Red: FF-fed mice. * = p < 0.05; ** = p < 0.01; *** = p < 0.001. (a) SCFA and BCFA concentrations in cecal contents in µmol/L after 40 days of feeding in FR- (n = 5) and FF-fed (n = 5) animals. Unpaired t-test, two-tailed. (b) Results for p-nitrophenyl glycoside-based enzyme assay from fecal samples of FR-fed (n = 4) and FF-fed (n = 4) animals. Evaluation of five different bacterial enzymes. Plant glycans: β-glucosidase, α-galactosidase. Mucin: α-fucosidase, β-N-acetylglucosaminidase, and sulfatase at three different time points. Day 1 before diet switch to FF diet, day 2 after diet switch to FF diet and day 9 after diet switch to FF diet. Green area indicates FR feeding period before diet switch to FF diet. Error bars represent SEM. Unpaired t-test, two-tailed. (c) Left panel: Alcian blue-stained 5 µm thin sections of the colonic mucus layer of FR-fed and FF-fed animals. Black arrows indicate thickness of the colonic mucus layer. Scale bar = 100 µm. Right panel: Statistical analysis of mucus layer measurements of FR-fed (n = 5) and FF-fed (n = 5) animals. Mann–Whitney test, two-tailed. (d) Colon length in FR- (n = 5) and FF-fed (n = 5) mice after 40 days of feeding. Mann–Whitney test, two-tailed. (e) Levels of lipocalin in fecal supernatant, normalized on fecal weight for FR- (n = 25) and FF-fed (n = 25) animals after 36–40 days of feeding. Mann–Whitney test, two tailed.