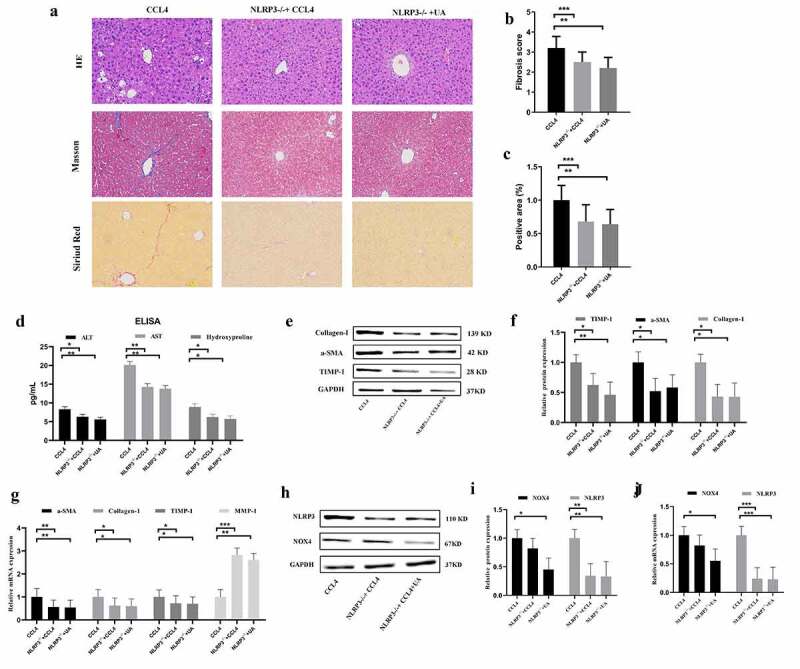
Figure 4.

Effect of UA on the expression of NLRP3 inflammasomes in NLRP3−/- mice. (a): HE staining, Masson’s trichrome staining and Sirius red staining (200× magnification); (b,c) The degree of fibrosis was assessed by fibrosis scoring and the positive area (%); (d) The levels of ALT, AST and hydroxyproline were measured by ELISA; (e-f) The expression of Collagen-1, α-SMA and TIMP-1 was measured by Western blotting; (g) The expression of α-SMA, Collagen-1, TIMP-1 and MMP-1 was measured by qRT-PCR; (h-i) The protein levels of NOX4 and NLRP3 in NLRP3−/- mice with liver fibrosis were measured by Western blotting; (j) The mRNA levels of NOX4 and NLRP3 in NLRP3−/- mice with liver fibrosis were measured by qRT-PCR. n = 6 per group. The data are presented as the means±SD in each group. *P < .050, **P < .010 and ***P < .001
