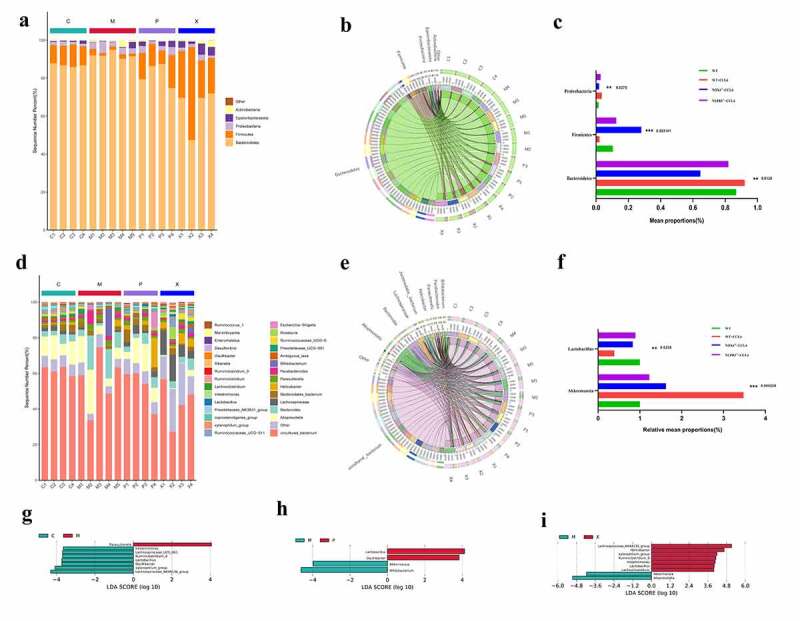
Figure 7.

Microbial abundance in four groups of mice with CCI4 induced liver fibrosis. (a-c): Composition of microbial abundance at the phylum level in the four groups; (d-f): Composition of microbial abundance at species level in the four groups; (g-i): Different gut microbial abundances in the four groups are shown by the linear discriminant analysis (LDA) score (log10). Abbreviation C: control group; M: WT+CCI4 group; P: NOX4−/- +CCI4 group; X: NLRP3−/- +CCI4 group. n = 4, 4, 4 of C, P, X group; n = 5 of M group. The data are presented as the means±SD in four groups. *P < .050, **P < .010 and ***P < .001
