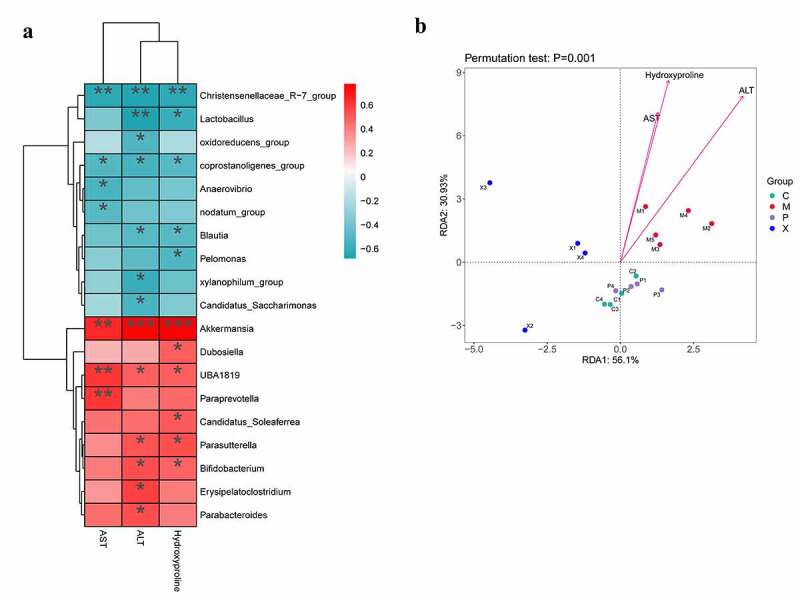
Figure 8.

Potential associations between microbial abundance and AST, ALT, and hydroxyproline in mice with liver fibrosis. (a): The associations between microbial abundance and AST, ALT, and hydroxyproline are shown in heat maps; (b): Redundancy analysis (RDA) was performed to reveal the association of microbial abundance in relation to AST, ALT, and hydroxyproline based on the relative microbial abundance at different taxa levels using the R package “vegan”. Abbreviation C: control group; M: WT+CCI4 group; P: NOX4−/- +CCI4 group; X: NLRP3−/- +CCI4 group. n = 4, 4, 4 of C, P, X group; n = 5 of M group. The data are presented as the means±SD in four groups. *P < .050, **P < .010 and ***P < .001
