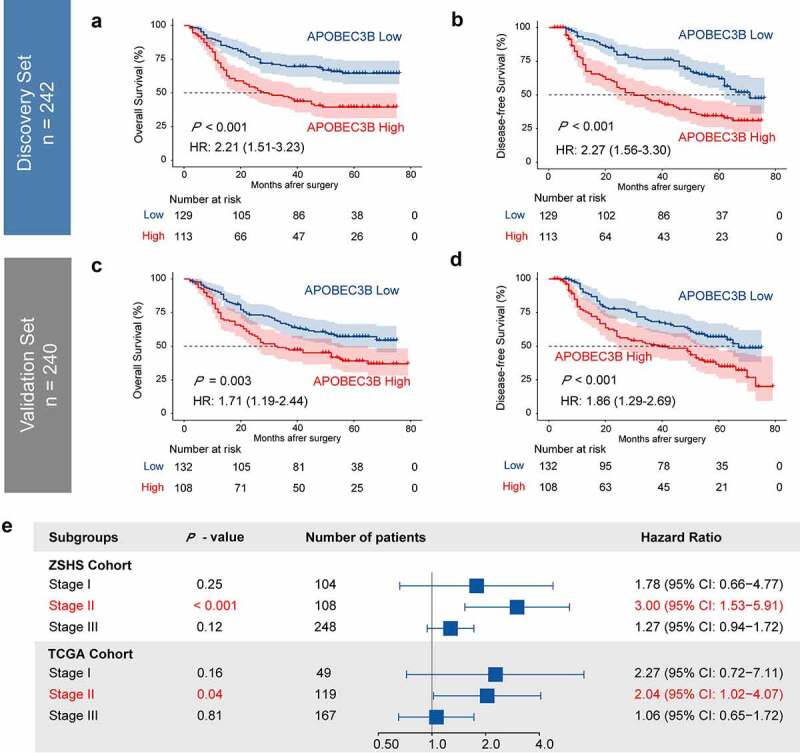
Figure 2.

Elevated expression of APOBEC3B predicted poor prognosis in GC. Four hundred and eighty-two patients in ZSHS Cohort were randomly divided into discovery set (n = 242) and validation set (n = 240). a-d, Kaplan–Meier curves indicated poor OS and DFS in patients with APOBEC3B-enriched tumors from discovery set (a, b) and validation set (c, d). e, Forest plot to show hazard ratio (HR) and 95% confidential interval (CI) of APOBEC3B expression in different TNM stages. Elevated APOBEC3B indicated poor OS in TNM stage II patients in both ZSHS Cohort and TCGA Cohort. All P values were two-sided
