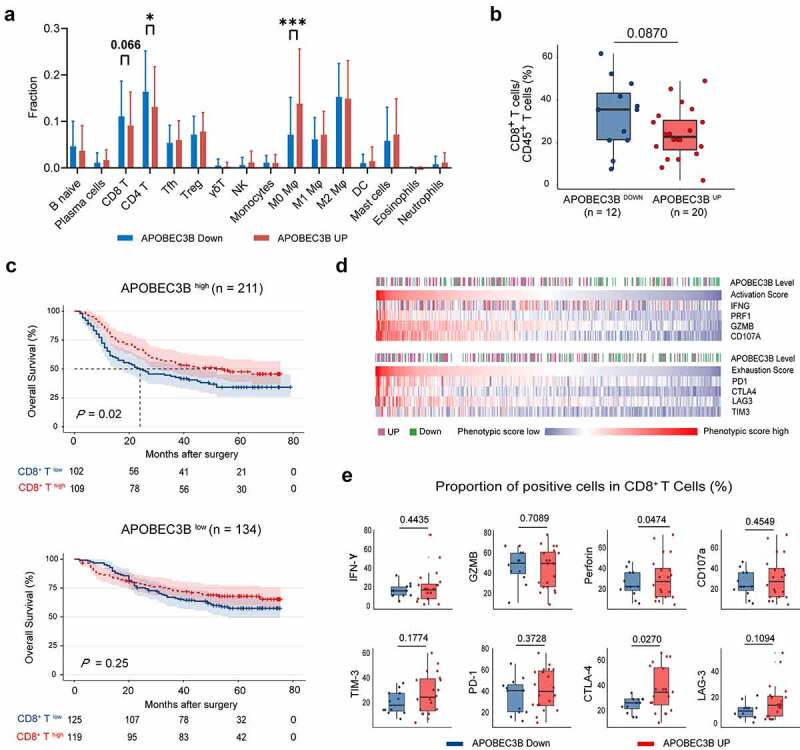
Figure 3.

APOBEC3B indicated decreased infiltration of CD8+ T cells in GC. a, The comprehensive immune contexture containing 16 kinds of immune cells was generated by CIBERSORT. Accumulated M0 polarized macrophages whereas decreased CD8+ T cells and CD4+ T cells were observed in APOBEC3B-enriched tumors. b, Flow cytometry analysis detected a trend toward negative association between CD8+ T cells proportion and APOBEC3B. c, Kaplan–Meier curves demonstrated that the infiltration of CD8+ T cells only indicated prolonged OS in APOBEC3B-enriched subgroups. d, Heatmap displayed associations between APOBEC3B expression and CD8+ T cell activation or exhaustion scores. CD8+ T cell phenotypic scores were calculated as corresponding mRNA level divided by CD8A expression. e, Flow cytometry detected the phenotype of CD8+ T cells in APOBEC3B-enriched tumors. Statistical analysis was performed with unpaired t test, *P < .05, **P < .01, ***P < .001. All shown P values were two-tailed
