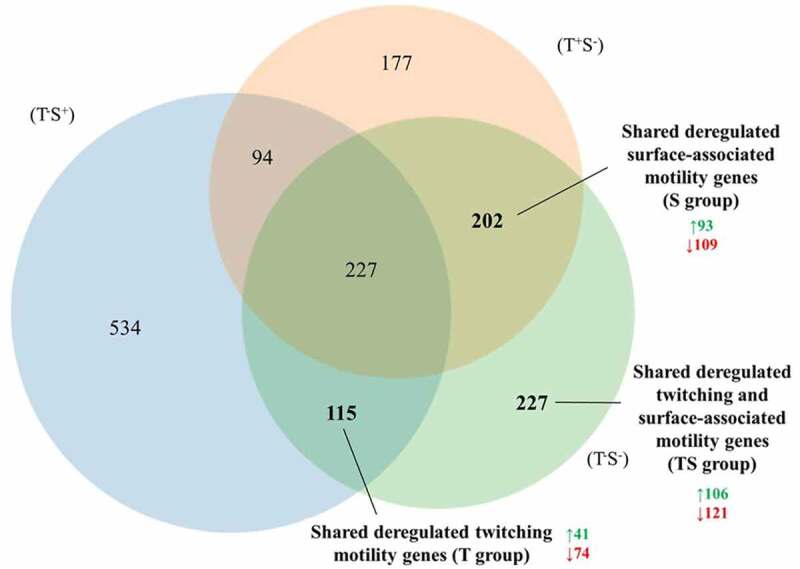
Figure 2.

Venn diagram of the distribution of deregulated genes in A. baumannii strains T−S−, T+S−, and T−S+. Overlapping areas represent deregulated genes identified in two or all three strains, and the numbers in bold the group of genes hypothetically involved in surface-associated motility, twitching motility, or both in A. baumannii strain MAR002. In the indicated groups, the total number of up-regulated (green) or down-regulated (red) genes is also shown
