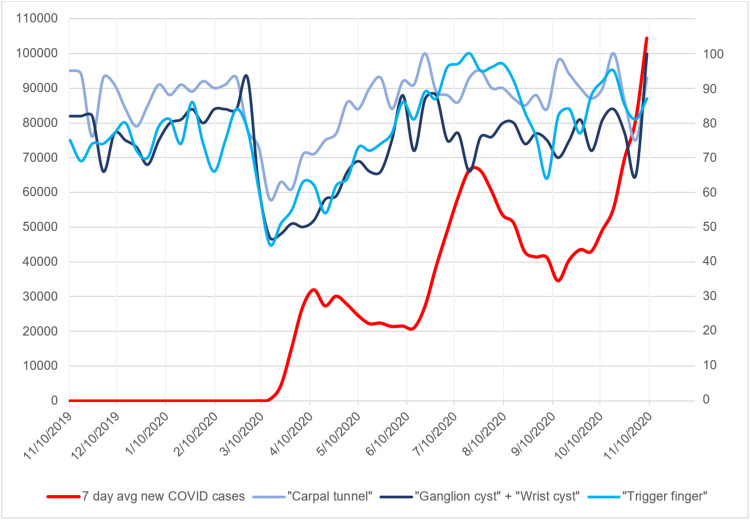
Figure 1. Seven-day average of new COVID-19 cases with search volume indices for hand pathology search terms.
Graph of seven-day average of new COVID-19 cases plotted against search volume indices for the hand pathology search terms “carpal tunnel,” “ganglion cyst” + “wrist cyst,” and “trigger finger.” x-axis represents time in months. Left-side y-axis represents number of new COVID-19 cases averaged over a seven-day period. Right-side y-axis represents relative search volume index for the above search terms.

