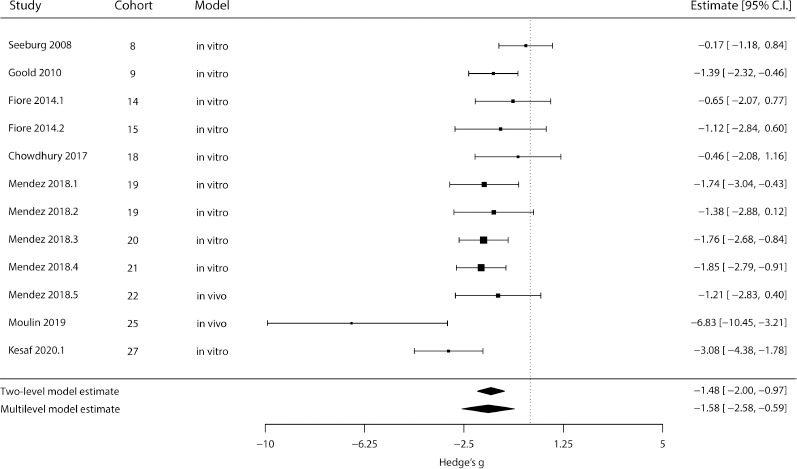
Figure 2.

Meta-analysis of dendritic spine density after chronic excitation.
The outer left column identifies the original article; the two middle columns define the experimental cohort and type of model, respectively; while the right column contains each experiment’s effect size (in Hedges’ g) and 95% confidence interval. Square sizes are proportional to the relative weight attributed to each study (for the multi-level model), and bars represent confidence intervals. Diamonds represent estimate results for the standard two-level random-effects model (top) and for the multi-level fully random-effects model (bottom). Negative effects mean a decrease in spine density, while positive effects would indicate an increase in this measure. CI: Confidence interval. All articles cited in this meta-analysis can be found at the reference list (Seeburg and Sheng, 2008; Goold and Nicoll, 2010; Fiore et al., 2014; Chowdhury et al., 2018; Mendez et al., 2018; Moulin et al., 2019; Kesaf et al., 2020).
