
Figure 4.
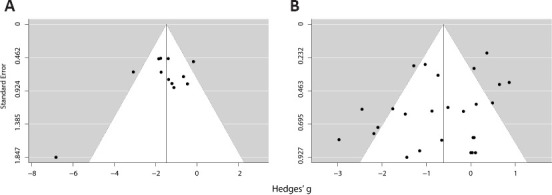
Funnel plots of chronic excitation (A) and chronic inhibition (B) interventions on extinction experiments.
Each experiment is represented by a black circle, with the vertical line marking the meta-analytic effect estimate and the white area representing a confidence interval region based on the standard error of this estimate. No missing study was found by trim-and-fill analysis.