Figure 9.

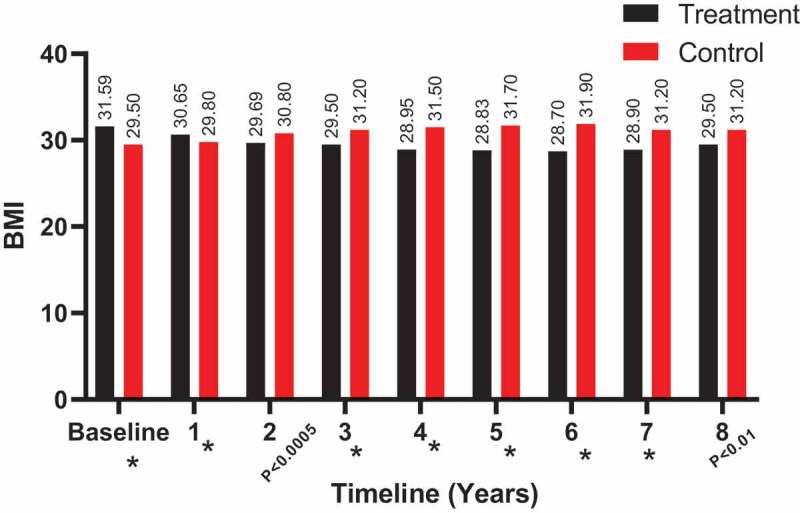
The BMI (kg/m2) at baseline and over the 8-year period for the 312 hypogonadal men in the T-group and 184 untreated hypogonadal men in the C-group (*P < 0.001)

The BMI (kg/m2) at baseline and over the 8-year period for the 312 hypogonadal men in the T-group and 184 untreated hypogonadal men in the C-group (*P < 0.001)