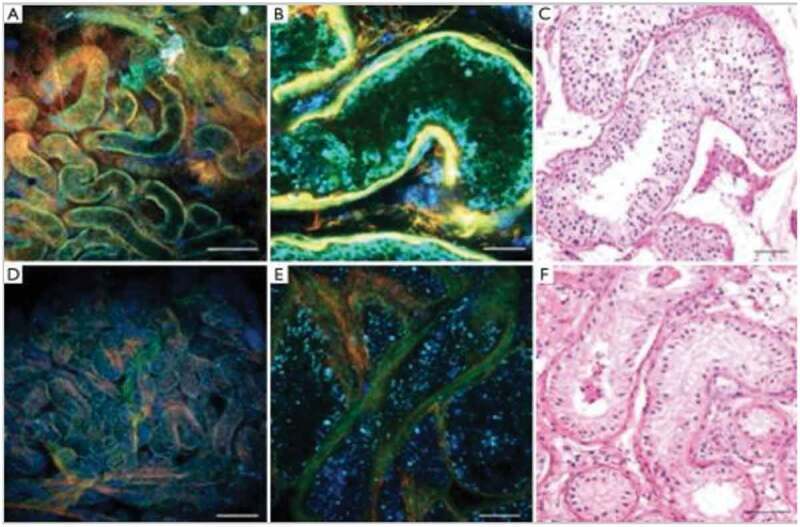
Figure 2.

Seminiferous tubular histology patterns imaged by MPM at low (a and d) and high (b and e) magnification compared to high magnification stained tissue (c and f). Normal spermatogenesis is shown by green areas in A to C and seminiferous tubules with SCO pathology is shown by blue areas in D to F. H&E (c and f). Scale bar represents 500 μm (a and d) and 80 μm (b,c,e,f). Permission for reproduction obtained from Elsevier Publishing, Ramasamy et al. [10]
