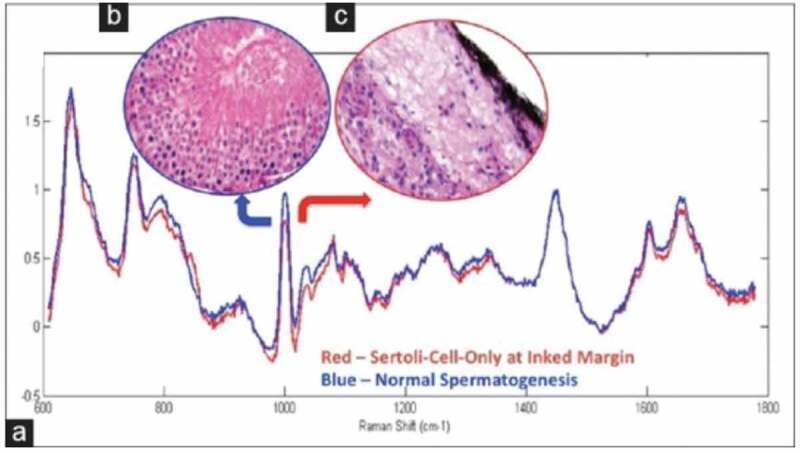
Figure 3.

(a) Mean processed spectra for SCO (red curve) and active spermatogenesis (blue curve) with 1000 and 1690 cm−1 discriminatory Raman peak intensity, respectively. (b) Representative testicular biopsy shows active spermatogenesis. (c) Representative testicular biopsy shows SCO. (b and c) H&E, reduced from ×200. Permission for reproduction obtained from Elsevier Publishing, Osterberg et al. [16]
