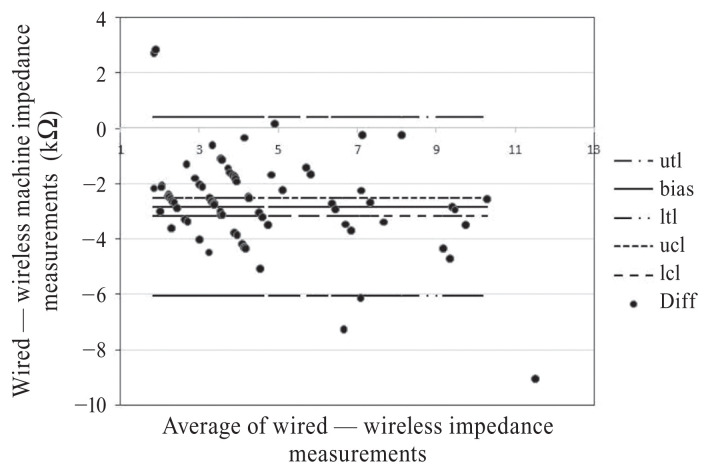
Figure 2.
Bland-Altman plot showing an average difference (bias) of 2.83 kΩ in which the wireless EEG impedance measurements were greater than the wired EEG impedance measurements, with a 2-sided upper tolerance limit (utl) and lower tolerance limit (ltl) of 0.403 kΩ and −6.065 kΩ, respectively. The confidence intervals on the differences (circles) have an upper control limit (ucl) of −2.514 kΩ and a lower control limit (lcl) of −3.148 kΩ.

