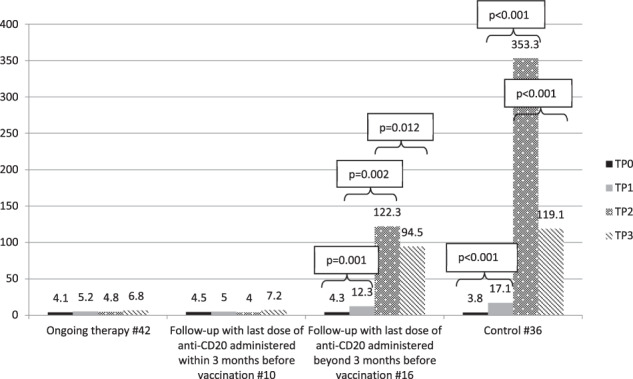
Fig. 1. IgG geometric mean concentrations on TP0, TP1, TP2, and TP3 in the cohorts, AU/mL.

TP0 is day of 1st dose, TP1 is day of 2nd dose (3rd week after 1st dose), TP2 is 5th week after 1st dose, TP3 is 12th week after 1st dose. To evaluate the effect of the second dose of vaccine and of IgG decay kinetics in the groups, the Wilcoxon test was used for comparing geometric mean concentration (GMC) between TP1, TP2, and TP3.
