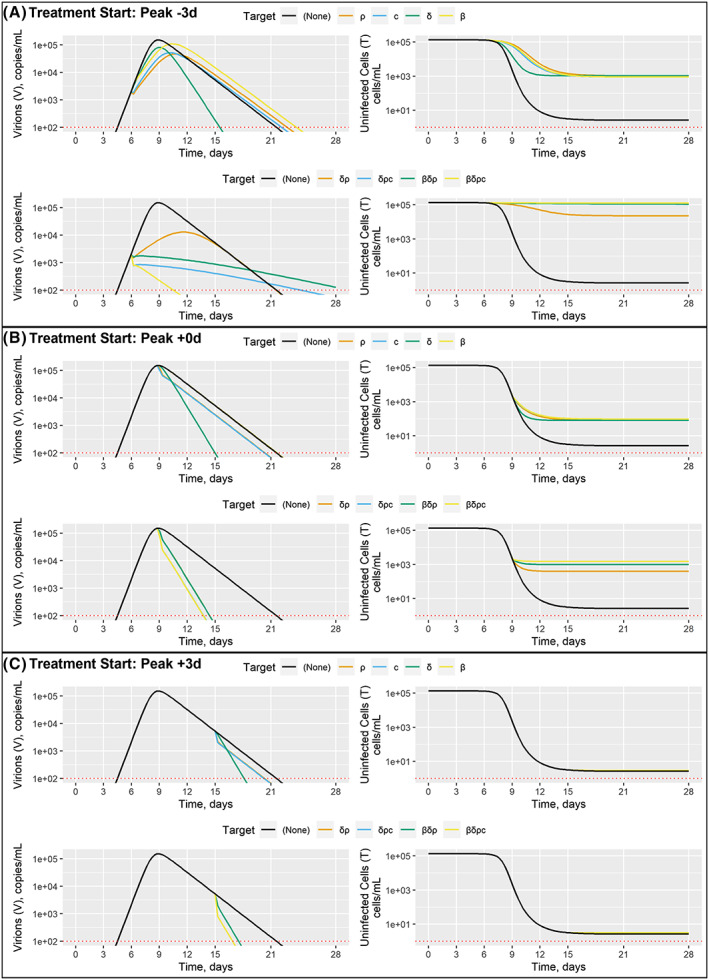
FIGURE 4.

Example combination treatments. Interventions initiated 3 days before, at, and 3 days after peak viral count are shown panels A, B and C, respectively; within each panel, single‐target and multiple‐target interventions are shown in the top and bottom rows, respectively, virion and uninfected endpoint are shown by column, simulation values over time are reported on the y and x axes, respectively, and specific targets are shown by colour with the no‐intervention (negative control) case shown in black
