FIGURE 2.

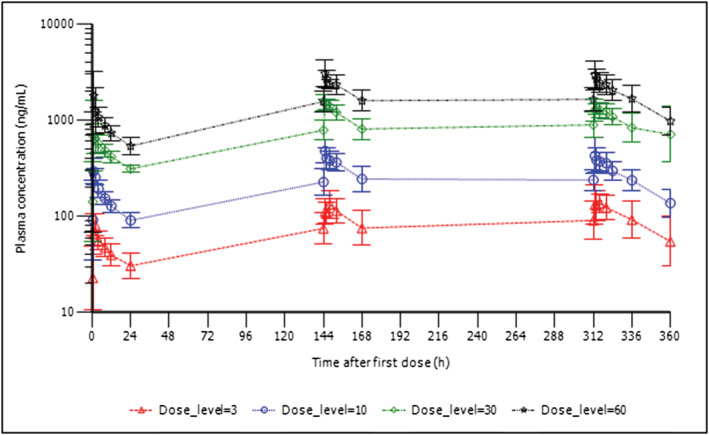
MAD study: Geometric mean (± geometric SD) plasma concentration of LTI‐291 against time (h) after dose following the first (top), seventh (middle) and fourteenth (bottom) oral dose of 3, 10, 30 or 60 mg LTI‐291

MAD study: Geometric mean (± geometric SD) plasma concentration of LTI‐291 against time (h) after dose following the first (top), seventh (middle) and fourteenth (bottom) oral dose of 3, 10, 30 or 60 mg LTI‐291