FIGURE 5.

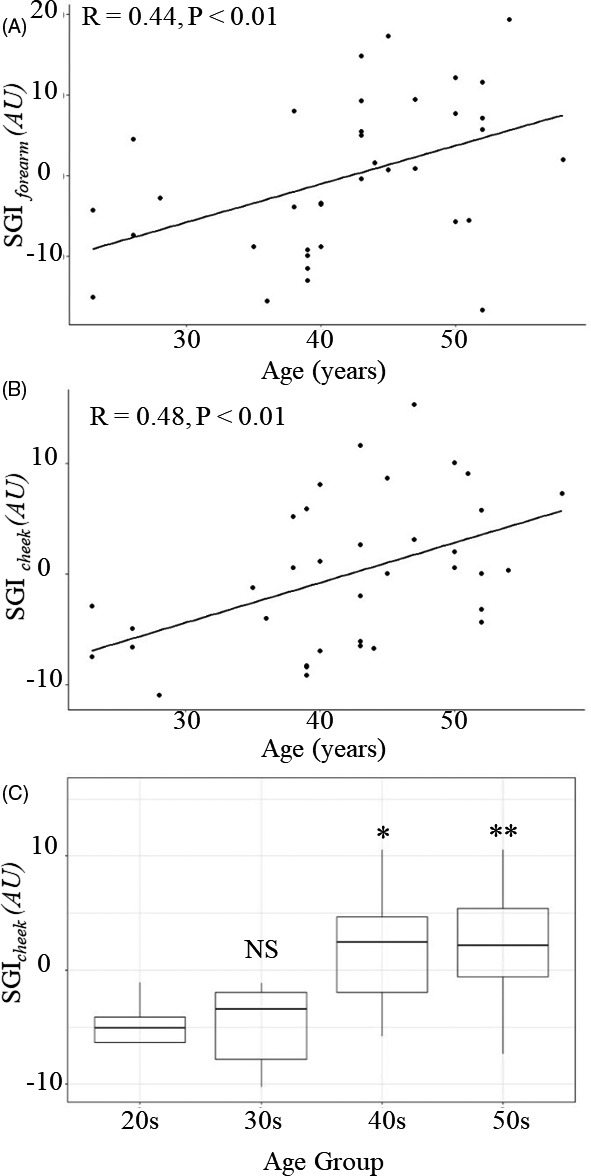
Scatter plots of the AGE level according to age (years). Correlations between age and (a) SGIforearm (R = 0.44, P < .01) and (b) SGIcheek (R = 0.48, P < .01). (c) Average SGIcheek value by age group (NS, no significant difference; *P < .05; **P < .01; compared with the 20s age group). AGEs, advanced glycation end products; SGIcheek, skin glycation index from the cheek measured using the facial glycation imaging system (FGIS); SGIforearm, skin glycation index from the volar forearm measured using the FGIS; AU, arbitrary unit
