
Figure 1.
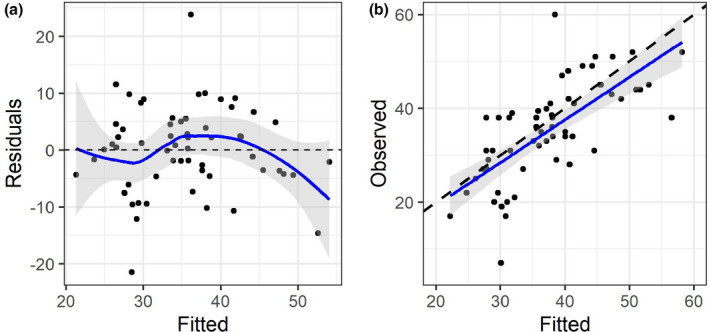
Distribution of error terms (plot A) and relationship between predicted and observed personal recovery scores in the test sample (plot B).
Official websites use .gov
A
.gov website belongs to an official
government organization in the United States.
Secure .gov websites use HTTPS
A lock (
) or https:// means you've safely
connected to the .gov website. Share sensitive
information only on official, secure websites.
Distribution of error terms (plot A) and relationship between predicted and observed personal recovery scores in the test sample (plot B).