
FIGURE 1.
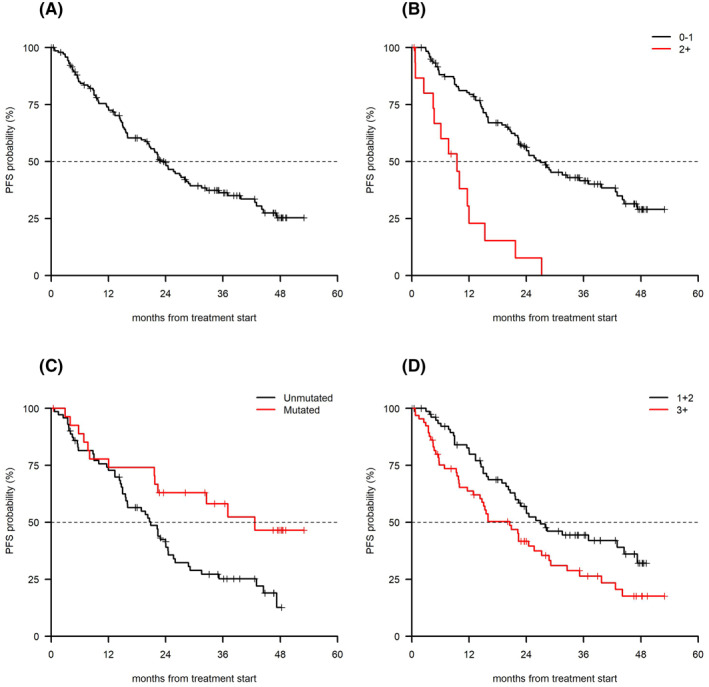
(A) Overall PFS, (B) PFS by ECOG ( p < 0.001), (C) PFS by IGHV status (p = 0.01), and (D) PFS by number of previous lines of therapy (p = 0.02). PFS, progression‐free survival
Official websites use .gov
A
.gov website belongs to an official
government organization in the United States.
Secure .gov websites use HTTPS
A lock (
) or https:// means you've safely
connected to the .gov website. Share sensitive
information only on official, secure websites.
(A) Overall PFS, (B) PFS by ECOG ( p < 0.001), (C) PFS by IGHV status (p = 0.01), and (D) PFS by number of previous lines of therapy (p = 0.02). PFS, progression‐free survival