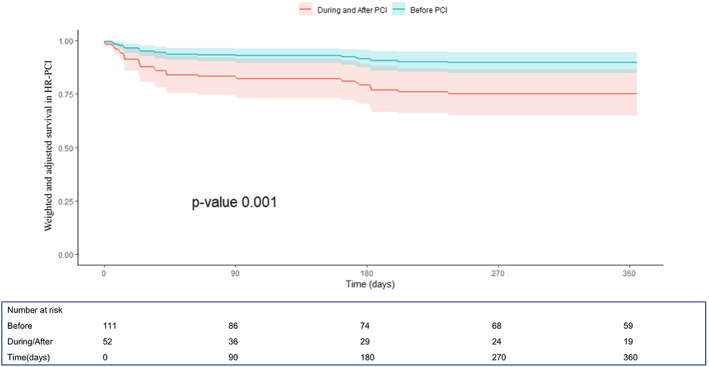
FIGURE 5.

One‐year survival curves derived from the Cox proportional hazard model after propensity score weighting and multivariable weighted Cox model adjustment from the IMP‐IT Registry in high‐risk percutaneous coronary interventions (HR‐PCI) patients (HR 0.35, C.I. [0.12–0.96], p = .001, before vs. during/after PCI), stratified by timing of insertion of Impella 2.5 and CP in relation to the interventional procedure
