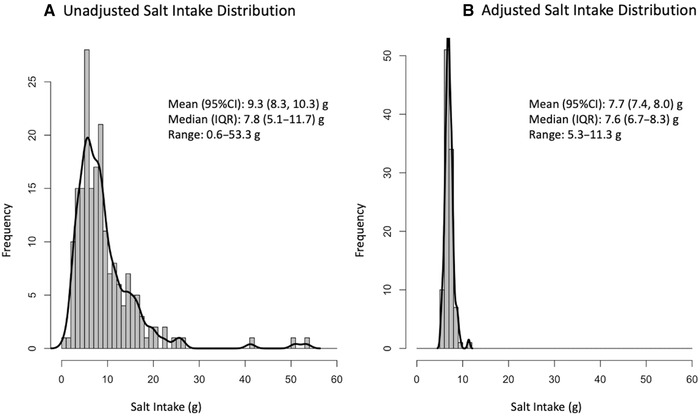
Figure 2.

Salt intake distributions (from table salt, soy sauce, fish sauce, and prahok) for lactating women in rural Cambodian before (A) and after (B) adjusting for intraindividual variance using the National Cancer Institute Usual Dietary Intake method.29
