
FIGURE 2.
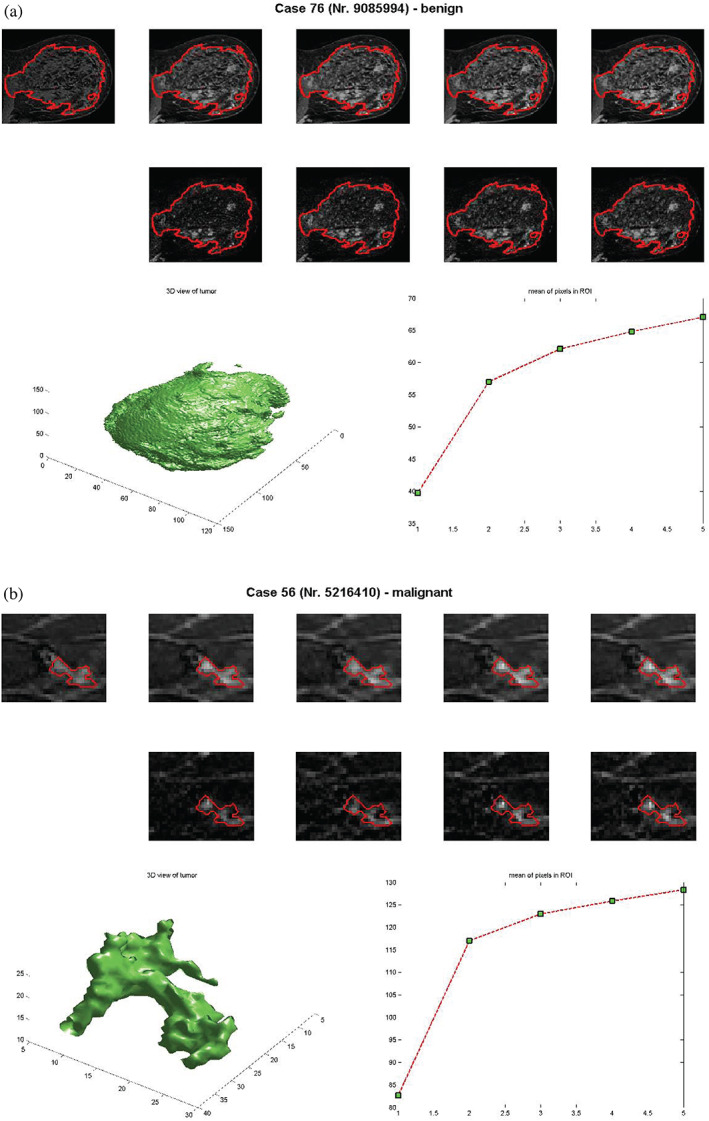
Morphological and dynamic representations of segmented benign (diffusely enhancing glandular tissue) and malignant (invasive ductal carcinoma) nonmass‐like‐enhancing lesions. The time‐scans in the first row are without motion compensation, while those in the second row are motion‐corrected. The left image in the last row shows the segmented tumor, while the right one shows the SI curve.