
FIGURE 4.
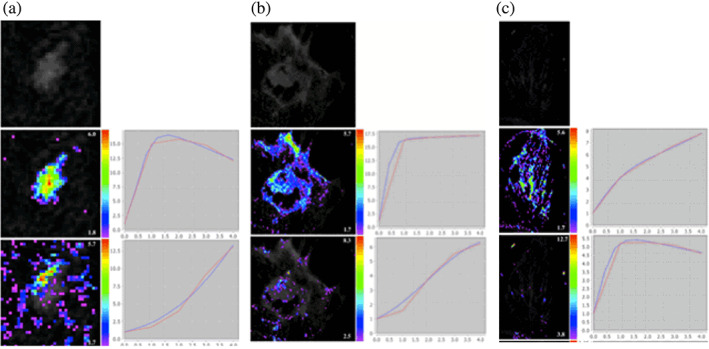
ICA segmentation at 1.5T for a benign (cylindrical cell changes) and two malignant lesions (carcinosarcoma and IDC with surrounding DCIS) showing cluster assignment maps (left of each image) and associated enhancement curves (right of each image) in red and their EMM based on the Gompertzian law in blue.