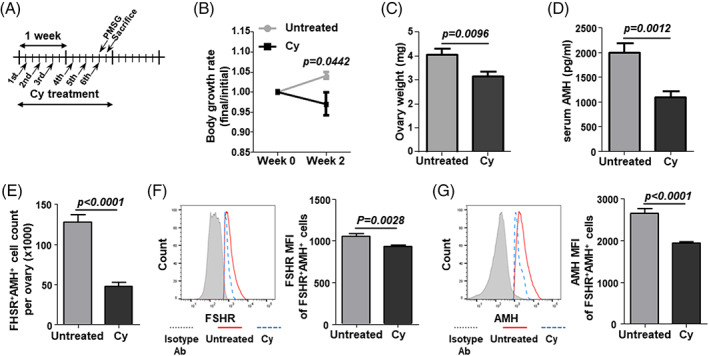
FIGURE 2.

AMH production and number of FSHR+AMH+ GCs at 24 h post‐Cy exposure. (A) Schematic of the in vivo study. Cy (100 mg/kg) was intraperitoneally injected into C57BL/6 mice 6 times over 2 weeks. GCs were isolated from PMSG‐stimulated ovaries at 24 h post‐Cy exposure. (B) Body growth was measured during the 2 weeks of Cy administration. (C) Ovary weight was measured. (D) Serum AMH levels were measured by ELISA. (E) The number of FSHR+AMH+ GCs per ovary were counted using counting beads. (F,G) The mean fluorescence intensity (MFI) of FSHR and AMH in FSHR+AMH+ GCs were calculated using the isotype control antibody‐stained cells (gray line). Untreated: untreated control mice; Cy: cyclophosphamide‐treated mice. Data represent the mean ± s.e.m. (n = 7–8/group). Ab, antibody; AMH, anti‐müllerian hormone; Cy, cyclophosphamide; ELISA, enzyme‐linked immunosorbent assay; FSHR, follicle‐stimulating hormone receptor; GC, granulosa cells; PMSG, pregnant mare's serum gonadotropin [Color figure can be viewed at wileyonlinelibrary.com]
