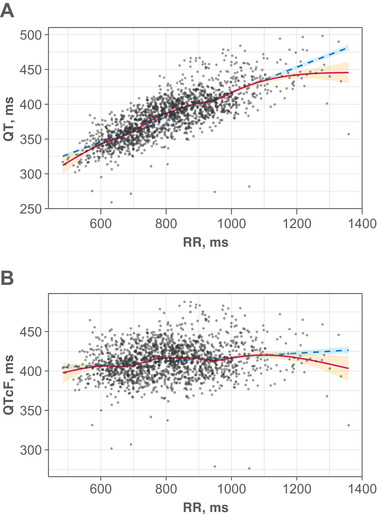
Figure 2.

Relationship between time‐matched (A) QT vs RR and (B) QTcF vs RR. The filled circles indicate individual observed data from Studies A and B. The red line is the smooth regression. The dashed blue line is the linear regression (R2 = 0.605 for QT vs RR; R2 = 0.0255 for QTcF vs RR). The orange and blue shaded areas represent 95% CI of smooth and linear regressions, respectively. CI, confidence interval; QTcF, QT corrected using the Fridericia formula.
