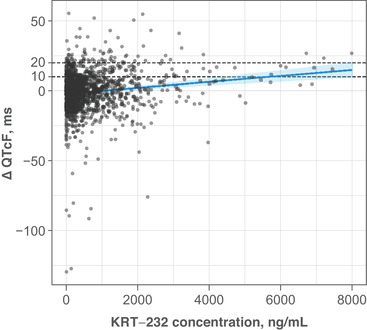
Figure 4.

Predicted relationship of ΔQTcF with KRT‐232 concentration. The filled circles indicate individual observed data from studies A and B. The solid blue line represents model‐predicted ΔQTcF over observed range of concentrations. The shaded blue area is the 90% confidence interval of model‐predicted mean ΔQTcF. The horizontal dashed black lines represent the ΔQTcF 10 and 20 ms thresholds. ΔQTcF change from baseline QT corrected using the Fridericia formula. The marginal coefficient of determination for the model (variance explained by the fixed effects only; ie, intercept, slope, and baseline) is 0.0634; the conditional coefficient of determination (variance explained by fixed plus random effects; ie, intercept variability—a substantial component of total variability) is 0.385. ΔQTcF, change from baseline Fridericia‐corrected QT interval.
