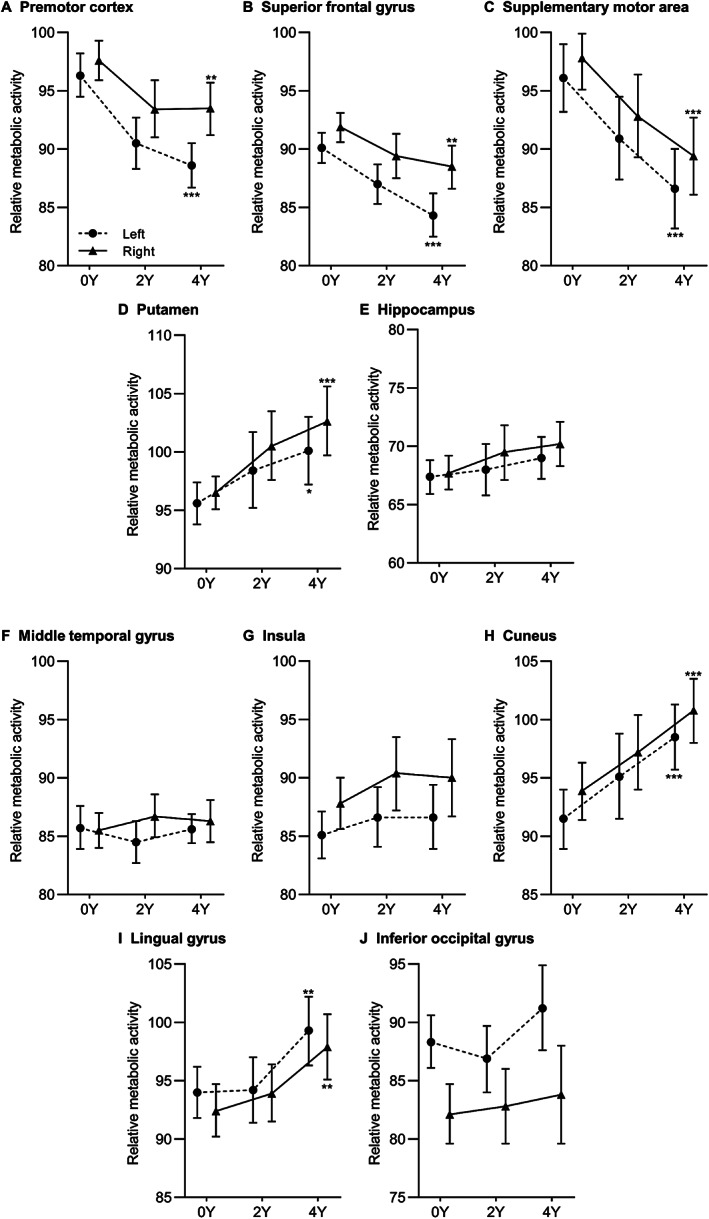
FIG. 3.

Longitudinal changes in relative metabolic activities of individual brain regions constituting rapid eye movement (REM) sleep behavior disorder‐related metabolic pattern (RBDRP) with positive activity (A–E) and negative activity (F–J) when using the global mean normalization method. *P < 0.05; **P < 0.01; ***P < 0.001 after false discovery rate adjustment. Y, year.
