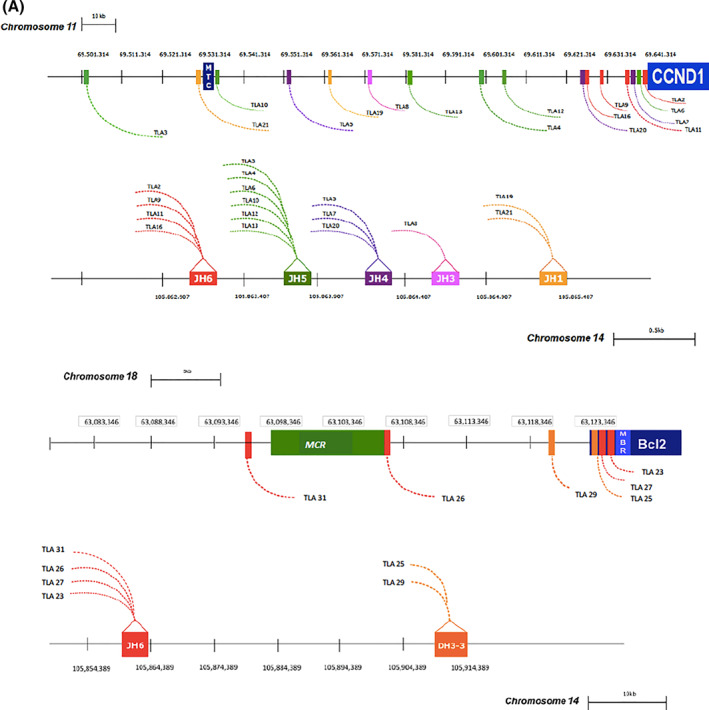
FIGURE 3.

Schematic representation of mated chromosomic regions compared to MTC, MBR, and MCR breakpoint genomic localization. MTC, major translocation cluster; CCND1, cyclin D1 gene; MBR, major breakpoint region; MCR, minor cluster region

Schematic representation of mated chromosomic regions compared to MTC, MBR, and MCR breakpoint genomic localization. MTC, major translocation cluster; CCND1, cyclin D1 gene; MBR, major breakpoint region; MCR, minor cluster region