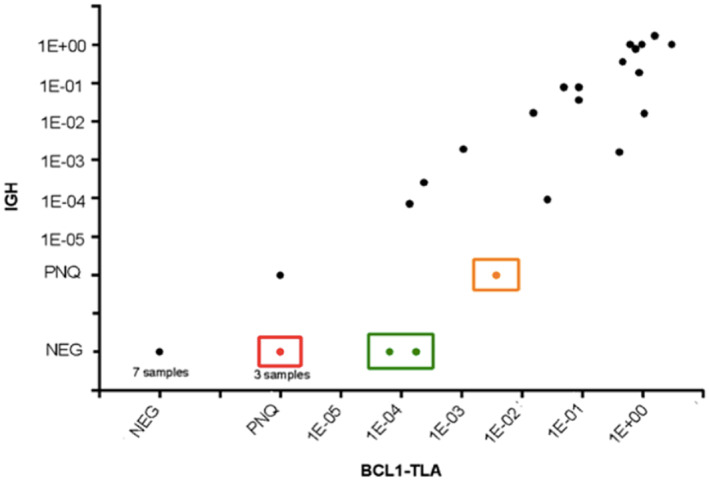
FIGURE 4.

Correlation between BCL1‐TLA and IGH quantification. Major discordances were described as positive or PNQ for BCL1‐TLA and negative for IGH (red dots), positive BCL1‐TLA versus negative IGH sample (green dots). Minor discordance resulted as positive for BCL1‐TLA and PNQ for IGH (orange dot)
