FIGURE 6.

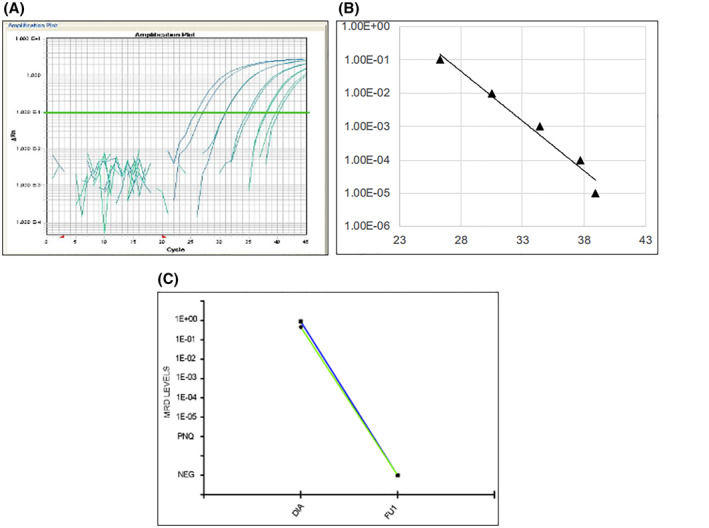
Targeted locust amplification 13 standard curve performances (panel A and B) and minimal residual disease trends in bone marrow (blue line) and peripheral blood (green line) follow ups targeting BCL1‐TLA (panel C)

Targeted locust amplification 13 standard curve performances (panel A and B) and minimal residual disease trends in bone marrow (blue line) and peripheral blood (green line) follow ups targeting BCL1‐TLA (panel C)