
Figure 6.
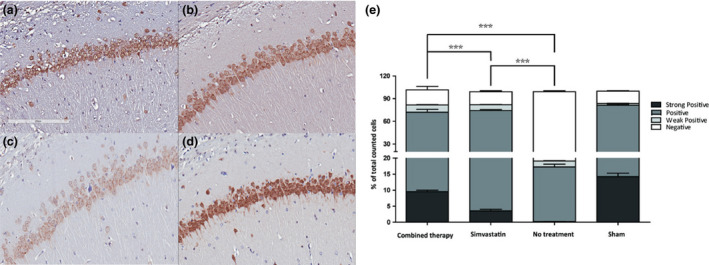
Photomicrographs of immunohistochemical staining of rat hippocampal CA1 in the (a) combination therapy, (b) simvastatin, (c) control, and (d) sham groups using antibodies specific for NeuN. (e) Cell number mean ± SEM (via Aperio software analysis) indicating different staining intensities across groups. The survival neurons with different intensity of NeuN staining were demonstrated in Figure 1. *P < 0.05, **P < 0.01, ***P < 0.005 (Student’s t‐test).