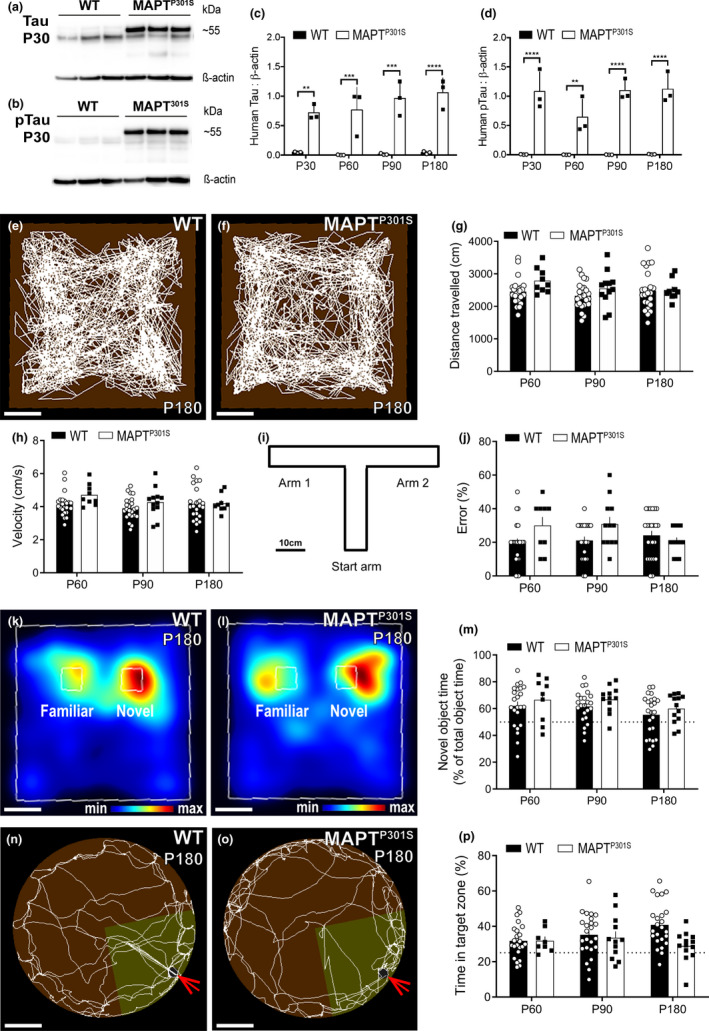
Figure 1.

MAPTP301S mice do not develop overt locomotor or memory impairment by P180 (a‐b) Representative Western blots probing for tau protein (a; human ~55 kDa; mouse ~51 kDa) and phosphorylated Tau (pTau) protein (b; human ~55 kDa, mouse ~51 kDa) in hippocampal brain lysates from P30 wild‐type (WT; open circles, black bars) and MAPTP301S (black squares, open bars) mice. (c) Quantification of human Tau protein expression relative to β‐actin expression in P30, P60, P90 and P180 WT and MAPTP301S mice [two‐way ANOVA, genotype: F (1, 16) = 110, p < .0001; age: F (3, 16) = 1.034, p = .4040; interaction: F (3, 16) = 0.9767, p = .4282]. (d) Quantification of human phosphorylated tau expression relative to β‐actin expression MAPTP301S and WT mice at P30, P60, P90 and P180 [two‐way ANOVA, genotype: F (1, 16) = 148.4, p < .0001; age: F (3, 16) = 2.078, p = .1434; interaction: F (3, 16) = 2.004, p = .1540]. (e‐f) Representative track visualisation images (EthoVision XT) showing movement (white lines) of P180 WT (e) and MAPTP301S (f) mice during the open field locomotor task. (g) Quantification of the total distance travelled by WT and MAPTP301S mice in the open field task at P60, P90 and P180 [two‐way ANOVA, genotype: F (1, 94) = 3.536, p = .0631; age: F (2, 94) = 1.180, p = .3119; interaction: F (2, 94) = 0.767, p = .4671]. (h) Quantification of the average movement velocity of WT and MAPTP301S mice during the open field task at P60, P90 and P180 [two‐way ANOVA, genotype: F (1, 94) = 3.466, p = .0658; age: F (2, 94) = 1.253, p = .2904; interaction: F (2, 94) = 0.8427, p = .4338]. (i) Schematic of the T‐maze apparatus. (j) Quantification of the proportion incorrect arm choices (errors) made by P60, P90 and P180 WT and MAPTP301S mice during the T‐maze alternation task [two‐way ANOVA, genotype: F (1, 96) = 4.317, p = .0404; age: F (2, 96) = 0.7271, p = .4859; interaction: F (2, 96) = 3.028, p = .0531]. (k‐l) Representative heat maps (EthoVision XT) showing the relative proportion of time P180 WT (k) and MAPT (l) mice spent exploring the familiar and novel objects during the novel object recognition task. Warmer colours represent a greater proportion of time in that area. (m) Quantification of the proportion of time P60, P90, and P180 WT or MAPTP301S mice spent exploring the novel object relative to the total time spent exploring either object [two‐way ANOVA, genotype: F (1, 98) = 2.823, p = .0961; age: F (2, 98) = 2.506, p = .0868; interaction: F (2, 98) = 0.006544, p = .9935]. (n‐o) Representative track visualisation images (EthoVision XT) showing movement (white lines) of P180 WT (n) and MAPTP301S (o) mice during the Barnes maze long‐term memory probe trial, carried out 2 weeks after mice learned the expected location of an escape box (red arrows). Yellow shading indicates the quadrant of the maze defined as the target zone. (p) Quantification of the proportion of time P60, P90, and P180 WT or MAPTP301S mice spent within the target zone during the long‐term memory probe trial [two‐way ANOVA, genotype: F (1, 98) = 3.708, p = .0570; age: F (2, 98) = 0.5633, p = .5711; interaction: F (2, 98) = 2.623, p = .0777]. Western blot data are presented as mean ± SD, n = 3 mice per group. Behaviour data are presented as mean ± SEM, n = 9–24 mice per group. Asterisks denote significant differences identified by Bonferroni post hoc analysis, **p < .01, ***p < .001, ****p < .0001. Scale bars represent 10 cm (e‐f, i, k‐l) and 25 cm (n‐o)
