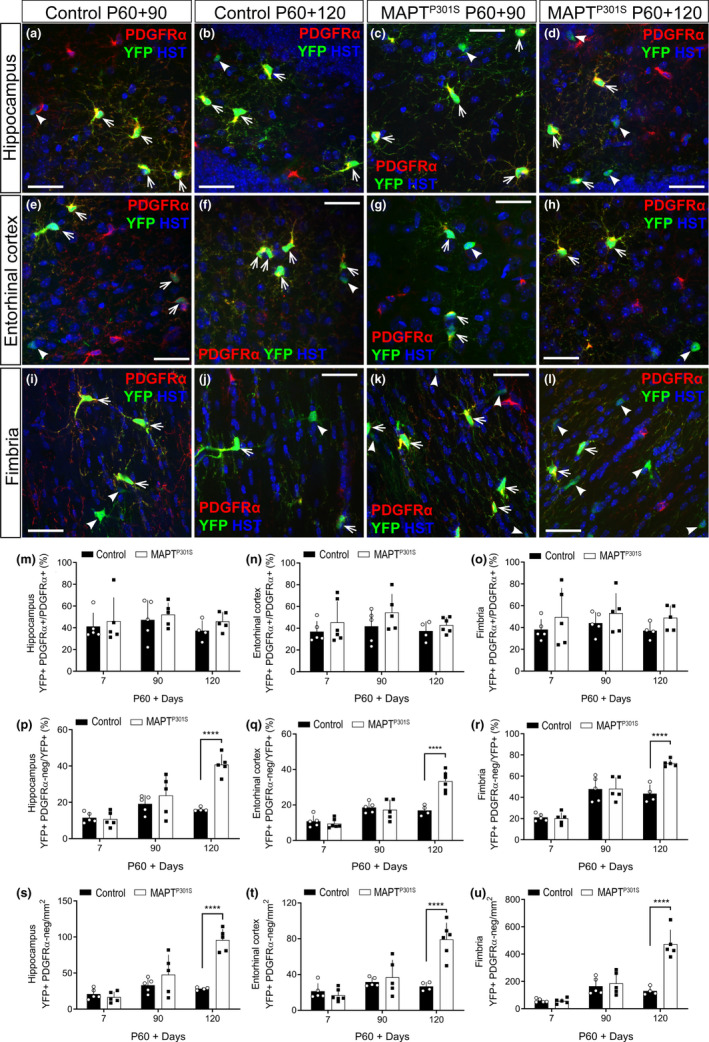
Figure 2.

New oligodendrocyte addition is increased in the hippocampus, entorhinal cortex and fimbria of MAPTP301S mice at P180. (a‐l) Representative confocal images showing PDGFRα (red), YFP (green) and Hoechst (blue) in the hippocampus (a‐d), entorhinal cortex (e‐h) and fimbria (i‐l) of Pdgfrα‐CreERT2::Rosa26‐YFP (control; a‐b, e‐f, i‐j) and Pdgfrα‐CreERT2::Rosa26‐YFP::Prnp‐MAPTP301S (MAPTP301S ; c‐d, g‐h, k‐l) mice at 90 (P60 + 90) and 120 (P60 + 120) days post tamoxifen administration (P60). (m‐o) Quantification of the proportion of recombined OPC (YFP+ PDGFRα+/PDGFRα+) in the hippocampus [(m): two‐way ANOVA, genotype: F (1, 23) = 1.272, p = .2710; age: F (2, 23) = 0.8038, p = .4598; interaction: F (2, 23) = 0.04821, p = .9530], the entorhinal cortex [(n): two‐way ANOVA, genotype: F (1, 25) = 3.13, p = .0891; age: F (2, 25) = 0.982, p = .3885; interaction: F (2, 25) = 0.169, p = .8455] and the fimbria [(o): two‐way ANOVA, genotype: F (1, 23) = 3.469, p = .0753; age: F (2, 23) = 0.3587, p = .7024; interaction: F (2, 23) = 0.02172, p = .9785] of control (open circles, black bars) and MAPTP301S (black squares, open bars) mice at 7, 90 and 120 days post tamoxifen administration (P60). (p‐r) Quantification of the proportion of recombined OPCs that differentiated into new oligodendrocytes (PDGFRα‐neg YFP+/YFP+) over 7, 90 and 120 days in the hippocampus [(p): two‐way ANOVA, genotype: F (1, 23) = 18.33, p = .0003; age: F (2, 23) = 20.33, p < .0001; interaction: F (2, 23) = 11.70, p = .0003], the entorhinal cortex [(q): two‐way ANOVA, genotype: F (1, 25) = 9.489, p = .0050; age: F (2, 25) = 34.13, p < .0001; interaction: F (2, 25) = 15.42, p < .0001] and the fimbria [(r): two‐way ANOVA, genotype: F (1, 23) = 10.18, p = .0041; age: F (2, 23) = 58.20, p < .0001; interaction: F (2, 23) = 10.49, p = .0006] of control and MAPTP301S mice. (s‐u) Quantification of the density of new oligodendrocytes (PDGFRα‐neg YFP+/mm2) added to the hippocampus [(s): two‐way ANOVA, genotype: F (1, 23) = 23.09, p < .0001; age: F (2, 23) = 20.88, p < .0001; interaction: F (2, 23) = 15.26, p < .0001], the entorhinal cortex [(t): two‐way ANOVA, genotype: F (1, 25) = 14.94, p = .0007; age: F (2, 25) = 18.28, p < .0001; interaction: F (2, 25) = 14.37, p < .0001] and the fimbria [(u): two‐way ANOVA, genotype: F (1, 23) = 26.15, p < .0001; age: F (2, 23) = 35.02, p < .0001; interaction: F (2, 23) = 21.65, p < .0001]. Data are presented as mean ± SD, n = 3–13 mice per group. Asterisks indicate significant differences identified by Bonferroni post hoc analysis, ****p < .0001. Scale bars represent 30 µm. Arrows indicate YFP+ PDGFRα+ recombined OPCs. Arrow heads indicate YFP+ PDGFRα‐neg newly added oligodendrocytes
