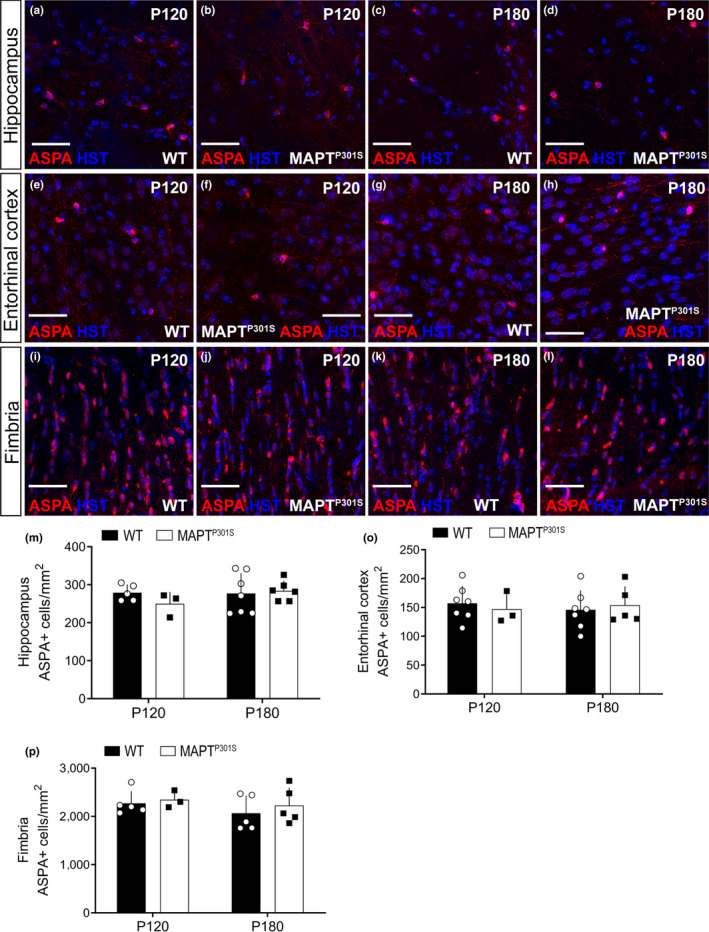
Figure 4.

Oligodendrocyte population is not altered in MAPTP301S mice at P120 and P180. (a‐l) Representative confocal images of ASPA (red) and Hoechst 33342 (blue) in the hippocampus (a‐d), entorhinal cortex (EC; e‐h) and fimbria (i‐l) of wild‐type (WT) and MAPTP301S mice at P120 and P180. (m‐o) Quantification of total oligodendrocyte density (ASPA+/mm2) in the hippocampus [(m): two‐way ANOVA, genotype: F (1, 17) = 0.417, p = .526; age: F (1, 17) = 0.849, p = .369; interaction: (1, 17) = 1.100, p = .308], the entorhinal cortex [(n): two‐way ANOVA, genotype: F (1, 18) = 0.004, p = .948; age: F (1, 18) = 0.0254, p = .875; interaction: F (1, 18) = 0.397, p = .536] and the fimbria [(o): two‐way ANOVA, genotype: F (1, 14) = 0.594, p = .453; age: F (1, 14) = 1.145, p = .302; interaction: F (1, 14) = 0.080, p = .781] of WT (open circles, black bars) and MAPTP301S (black squares, open bars) mice at P120 and P180. Data are presented as mean ± SD, n = 3–5 mice per group. Scale bars represent 40 µm
