Figure 5.

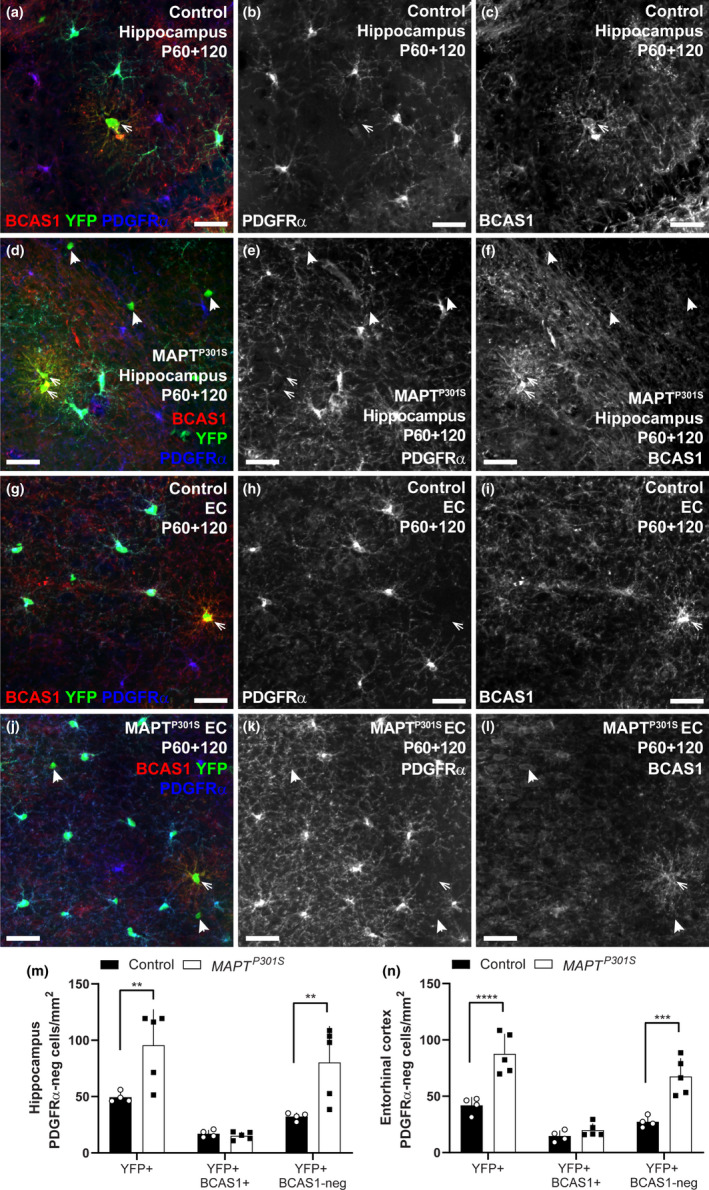
P60 + 120 MAPTP301S and control mice have a similar number of newborn BCAS1+ premyelinating oligodendrocytes in the hippocampus and entorhinal cortex. (a‐f) Representative confocal images showing BCAS1 (red), PDGFRα (blue) and YFP (green) in the hippocampus of P60 + 120 Pdgfrα‐CreERT2::Rosa26‐YFP (control; a‐c) and Pdgfrα‐CreERT2::Rosa26‐YFP::Prnp‐MAPTP301S (MAPTP301S ; d‐f) mice at ~Bregma −2.7. (g‐l) Representative confocal images showing BCAS1 (red), PDGFRα (blue) and YFP (green) in the entorhinal cortex (EC) of P60 + 120 Pdgfrα‐CreERT2::Rosa26‐YFP (control; g‐i) and Pdgfrα‐CreERT2::Rosa26‐YFP::Prnp‐MAPTP301S (MAPTP301S ; j‐l) mice at ~Bregma −2.7. (m) Quantification of the density of all YFP+ cells that are PDGFRα‐negative in the hippocampus of P60 + 120 control and MAPTP301S mice, including those that are YFP+ PDGFRα‐negative BCAS1+ premyelinating oligodendrocytes versus YFP+ PDGFRα‐negative BCAS1‐negative mature oligodendrocytes. [two‐way ANOVA, genotype: F (1, 21) = 15.73, p = .0007; cell type: F (2, 21) = 18.59, p < .0001; interaction: F (2, 21) = 4.428., p = .024]. (n) Quantification of the density of all YFP+ cells that are PDGFRα‐negative in the entorhinal cortex of P60 + 120 control and MAPTP301S mice, including those that are YFP+ PDGFRα‐negative BCAS1+ premyelinating oligodendrocytes versus YFP+ PDGFRα‐negative BCAS1‐negative mature oligodendrocytes. [two‐way ANOVA, genotype: F (1, 21) = 46.37, p < .0001; cell type: F (2, 21) = 38.57, p < .0001; interaction: F (2, 21) = 8.00, p = .002]. Asterisks indicate significant differences identified by Bonferroni post hoc analysis, **p < .01, ***p < .001, ****p < .0001. Scale bars represent 35 µm
