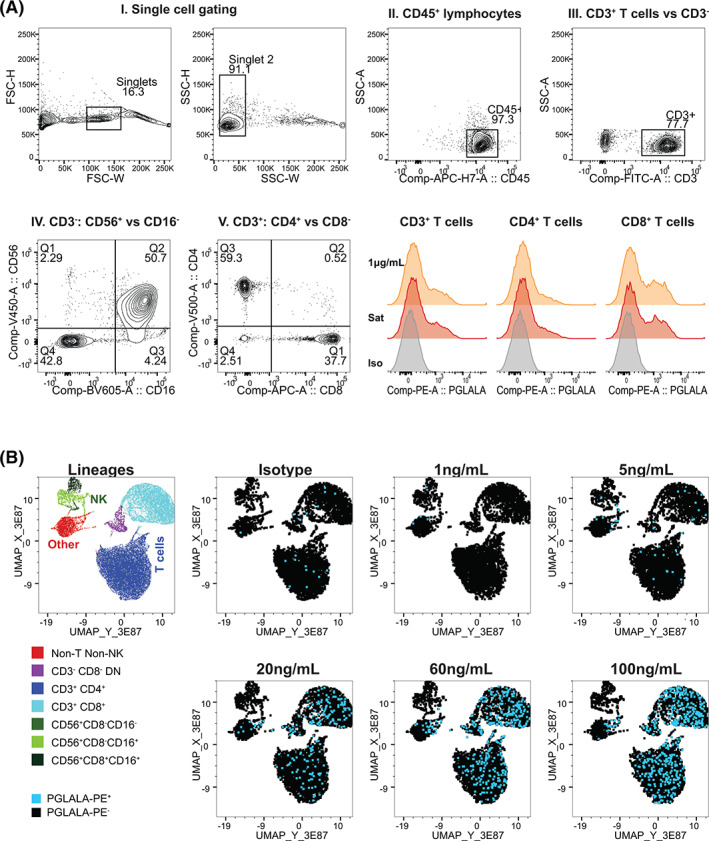
FIGURE 2.

Validation of RG7769 receptor occupancy (RO) assay for whole‐blood T cell RO analysis. (A) Gating strategy for RO calculation. I. In all conditions, single lymphocytes were identified by excluding cell doublets via FSC‐H versus FSC‐W followed by SSC‐H versus SSC‐W. II. Total lymphocytes were gated on via CD45 staining versus SSC‐A. III. Within the CD45+ compartment, T cells were identified via CD3 expression. A non‐T cell gate (NOT‐CD3+) was set. IV. Within total CD3+ T cells, CD4+ (Q3) and CD8+ single‐positive (Q1) T cells were identified. V. In the non‐T cell population, NK cells were identified via CD56 versus CD16 (QI‐III). Total NK cells were defined as CD56+CD16+/−. Lower right: Comparing the anti‐PGLALA‐PE staining intensity of CD3+ T cells, CD4+ and CD8+ T cells pulsed with RG7769. Orange: 1 μg/ml, red: Saturation (100 μg/ml); gray: Negative control (1000 ng/ml + mIgG2b‐isotype‐PE). (B) Dose–response of RG7769 binding to healthy donor lymphocytes. Using the gating strategy in A, CD45+ lymphocyte single cells from blood pulsed ex vivo with RG7769 (0 ng/ml➔100 ng/ml), were identified. The control group (0 ng/ml) was stained with mIgG2b‐PE isotype, cells with RG7769 with anti‐PGLALA‐PE. Five thousand concatenated CD45+ events were clustered according to CD3, CD4, CD8, CD56 and CD16 by UMAP. Left: Cell lineages identified using FlowSOM include CD4+ T cells, CD8+ T cells, CD4−CD8− unconventional T cells as well as NK cell subsets. Right: PE+ (RG7769+) T cells (blue) [Color figure can be viewed at wileyonlinelibrary.com]
