
FIGURE 3.
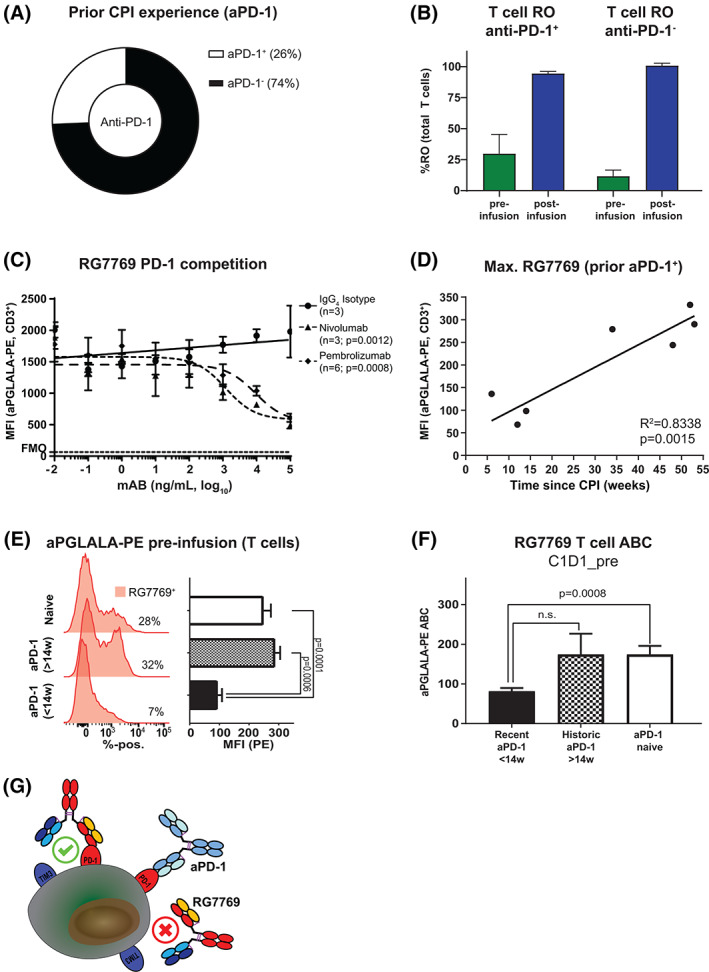
Assessing RG7769 binding to T cells in anti‐PD‐1 experienced patients. (A) Comparison of the frequency of NP40435 patients with prior aPD‐1 experience with aPD‐1 naïve patients. (B) Comparison of RG7769 CD3+ T cell receptor occupancy (RO) pre‐ and post‐infusion in NP40435 patients. (C) Control in vitro experiment assessing the effect of PD‐1 competition on RG7769 binding to CD3+ T cells. Activated peripheral blood mononuclear cells (PBMCs) were incubated with IgG4 isotype, nivolumab or pembrolizumab (100 pg/ml➔100 μg/ml), then pulsed with RG7769 (10 μg/ml), and analyzed for T cell anti‐PGLALA‐PE binding. The pooled MFI for PE is shown (data from two independent experiments). (D) Linear regression of max. RG7769 (MFI) to CD3+ T cells in NP40435 anti‐PD‐1+ patients prior to RG7769 infusion (C1D1_pre) as a function of the last reported prior anti‐PD‐1 administration. R 2 = .8338, p = 0.0015. (E) anti‐PGLALA‐PE staining on CD3+ T cells of representative NP40435 patients. Maximum anti‐PGLALA‐PE assessed post ex vivo blood saturation with RG7769, in recently (up to 14 weeks) or historically experienced (>14 weeks) patients versus naïve patients prior to RG7769 (C1D1_pre). Anti‐PGLALA–PE intensities are shown for ex‐vivo saturation and neg. control. (F) CD3+ T cell RG7769 mean ABC in recently (<14 weeks) or historically (>14 weeks) aPD‐1+ patients versus naïve. Data are pooled from (E). ABCs were compared to aPD‐1 naïve (Welch ANOVA test). (G) Schematic of RG7769 binding to T cells in aPD‐1+ patients. Left: RG7769 engages T cells via high‐affinity anti‐PD‐1 engagement if PD‐1 is freely available. Right: In situations where prior aPD‐1 is engaging PD‐1, RG7769 has to displace prior bound aPD‐1 antibodies. Steric hindrance may occur if competing mAbs target an epitope in the PD‐L1 interaction side of PD‐1 [Color figure can be viewed at wileyonlinelibrary.com]