Figure 3.

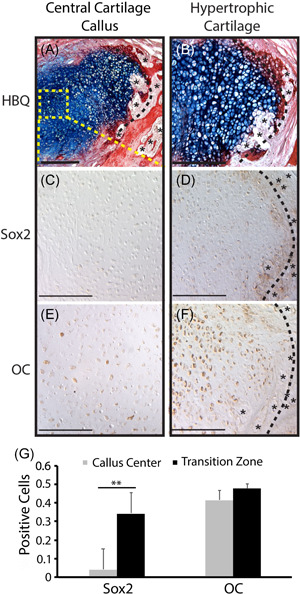
Hypertrophic chondrocytes at the mandibular fracture callus transition zone express stem cell and osteogenic markers. C57BL/6 mandibles were given unstable osteotomies and harvested 10 days postfracture. HBQ (A, B) histology shows a robust TZ (black dotted line) region within the fracture callus, marked by newly formed blood vessels (*) of the invading vasculature at the chondro‐osseous junction. Immunohistochemical analysis demonstrates that hypertrophic chondrocytes at the TZ express the stem cell marker Sox 2(D) as well as the classic osteogenic marker Osteocalcin(F). Chondrocytes at the center of the cartilage callus and distant from the TZ (boxed region in A) either do not express these genes or express at a significantly lower level (C, E). Quantification of % positively staining cells (G) reveals a statistically significantly difference in staining patterns between these two regions for Sox2. However, a statistically significant difference was not noted for OC. This is likely due to the inclusion of cells with even faint staining as positive. Qualitative comparison of the two regions demonstrates a consistent difference in the strength of staining. HBQ: cartilage is blue, bone is red. N = 5/antibody. Scale = 200 µm. HBQ, hall brunt quadruple; OC, osteocalcin; TZ, transition zone [Color figure can be viewed at wileyonlinelibrary.com]
