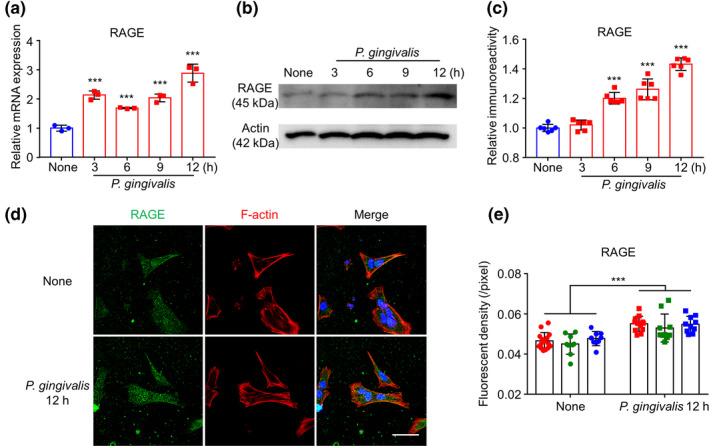
FIGURE 1.

RAGE expression increased in hCMEC/D3 cells after P. gingivalis infection. (a) The mean mRNA expression level of RAGE increased in cultured hCMEC/D3 cells after P. gingivalis infection (n = 3 independent cell culture preparations, ***p < .001; one‐way ANOVA). Asterisks indicate a statistically significant difference versus “None” group. (b) The immunoblots show RAGE increased in hCMEC/D3 cells after P. gingivalis infection. (c) The quantitative analysis of RAGE in the immunoblots in (b) (n = 6 independent cell culture preparations, ***p < .001; one‐way ANOVA). Asterisks indicate a statistically significant difference versus “None” group. (d) The immunofluorescent CLMS images of RAGE (green) in hCMEC/D3 cells with Hoechst‐stained nuclei (blue) and F‐actin (red) 12 hr after P. gingivalis infection. Scale bar, 50 μm. (e) The quantitative analysis of RAGE fluorescence density in the images in (d) (each color represents one independent cell culture preparations, ***p < .01; multiple t‐test). Asterisks indicate a statistically significant difference versus “None” group
